A big hat-tip to one of my former grad. students, Ryan MacDonald at Statistics Canada, for bringing to my attention a really informative C.D. Howe Institute Working Paper by Philip Cross (former Chief Economic Analyst at Statistics Canada).
The paper is titled, "What do the Different Measures of GDP Tell us?"
We all know what's meant by Gross Domestic Product (GDP), don't we? O.K., but do you know that there are lots of different ways of calculating GDP, including the six that Philip discusses in detail in his paper, namely:
- GDP by industry
- GDP by expenditure
- GDP by income
- The quantity equation
- GDP by input/output
- GDP by factor input
Well, for one thing - and this is one of the major themes of Philip's paper - how we view (and compute) GDP has important implications for policy-making. And, it's important to be aware that different ways of measuring GDP can result in different numbers.
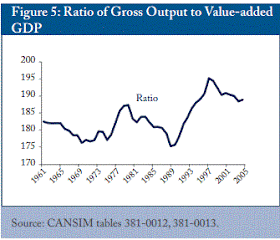
For instance, consider this chart from p.16 of the Philip's paper:
My first reaction when I saw this was "it's not flat". However, as RMM has commented below, "the line actually shows us the fluctuations of industries that are more intermediate compared with industries (or the total) that includes only final goods. Interesting and useful for business cycle analysis..."
Here's my take-away (p.18 of the paper):
"For statisticians, the different measures of GDP act as an internal check on their conceptual and empirical consistency. For economists, the different optics for viewing economic activity lead to a more profound understanding of the process of economic growth. Good analysis and policy prescription often depend on finding the right optic to understand a particular problem."Let's all keep this in mind when we look at the "raw numbers".
