Monday, April 18, 2011

Laughing Our Way Out of a Recession

Don't ask me why, but the other day I was thinking about one of my all-time favourite opening sentences in an academic paper:

         "0.    Introduction.   Consider a light bulb."
         (Balkema and de Haan, 1974, p.792.)

It has a certain ring to it, doesn't it? It takes courage to begin a paper in that way. More courage than I have! From there, it was just a small leap to begin reminiscing about memorable light bulb jokes, but I'm not going to go down that track. Actually, I don't have a stock of econometrics jokes, though I recognize that many jokes are very "transportable" across professions. For instance, we could quite easily convert the line, "Once I couldn't even spell 'Engineer' - now I are one!", into something that hits a little closer to home, also beginning with an 'E'. But I digress!

In recent times there's been a lot of press relating to measuring 'happiness' (whatever that is), and to the idea that perhaps we should replace measures such as GDP with some sort of Gross National Happiness Index, at least for certain purposes. I'm not sure what I could possibly add to that discussion directly, but it got me thinking about how our mood is governed in part by the state of the economy, and that perhaps this is reflected in our use of humour to deal with both personal and economic depression.

A lot of cartoons that appear in newspapers and magazines relate, not too surprisingly, to political events and politicians. Political satire has always been popular. It's also the case that a decent number of these cartoons relate specifically to economic matters. Of course, I know that there is often an overlap between economics and politics. None the less, I think we'll all agree that we regularly see cartoons whose primary focus is some aspect of the economy.

Friday, April 15, 2011

Price Indices From Regression Models

We're all familiar with index numbers. We encounter them every day - perhaps in the form of the CPI or the PPI;  or maybe in the form of some index of production. The effective exchange rate is an index that I'll be posting about in the near future. Share price indices are also familiar, although the DJIA has some very peculiar aspects to its construction that deserve separate consideration on another occasion.

The thing about an index number is that it has only ordinal content. That's to say, if  a particular price index, say P, has a (unit-less) value of 110, that number tells us nothing about the price level at all. It's only when we compare two values of the same index - say, the values in 2010 and in 2011 - that the numbers really mean anything. If P = 100 in 2010 and P = 105 in 2011, then the average price of the bundle of goods being measured by P has changed (risen in this case) by 5% - not by $5 or some other value. In other words, over time, or perhaps across regions, an index number measures proportional changes.

When any index number is constructed, a base period and a base value must first be chosen. For example, we might decide to choose a base year of 1996, and a base value of 100. There's absolutely nothing wrong with choosing a base value of, say, 167.5290 in 1996 - it would just be unnecessarily inconvenient. In that case if the index rose to 184.2819 in 1997, this would imply a relative price change of 100*[(184.2819 - 167.5290) / 167.5290] = 10%. Wouldn't it have been easier if we had chosen the base value to be 100, observed a value of 110 in 1997, and then been able to see immediately that this implied a 10% increase in prices over this one-year period?

Of course, it's the fact that an index measures only relative changes over time that enables us to "re-base" (change the base year) an index without losing any information at all. The numbers in the index series just get scaled, multiplicatively, by the same factor, leaving relative values - and the implications for price changes -  unaltered.

Monday, April 11, 2011

My Tips Jar

I think it's time to put the "tips jar" out on my office desk again. I used to have one, but I gave up after a certain colleague (?) emptied the coins out and bought himself a new car  - or was it a cup of coffee? I figured, if they have a tips jar on the counter at the coffee shop, why can't I have one too? Seemed like a great idea at the time (standard excuse), but in fact it just didn't work out too well. At least I didn't have to worry about reporting the extra cash to the CRA! 

Friday, April 8, 2011

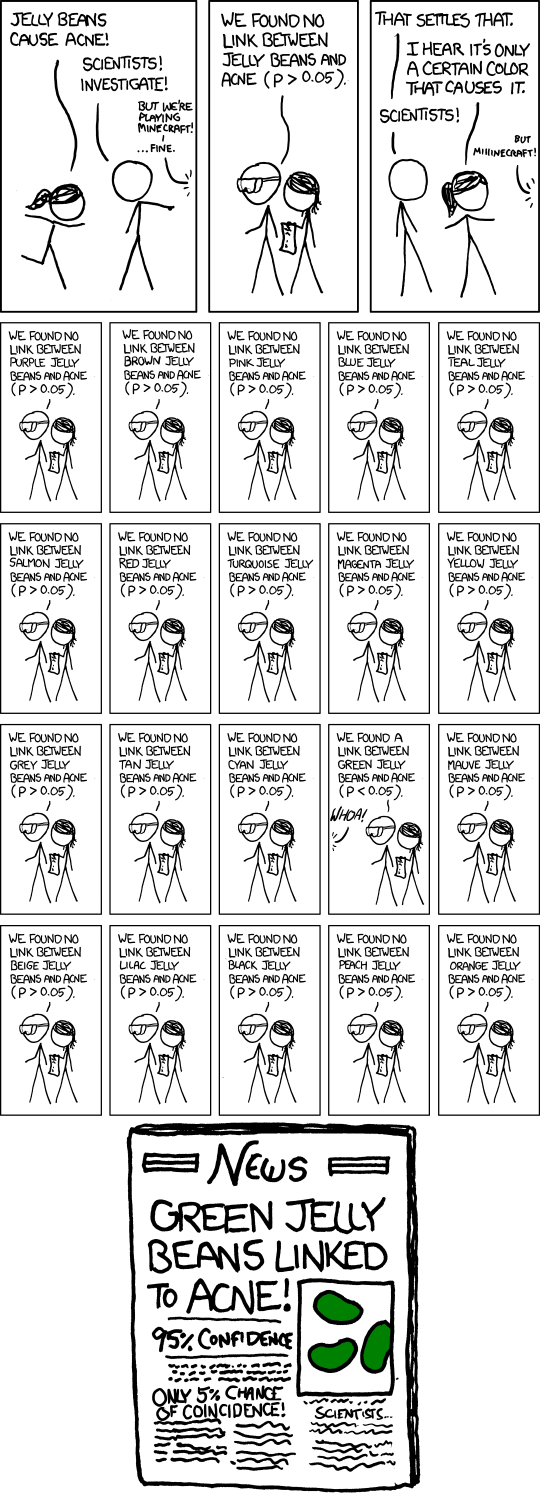
May I Show You My Collection of p-Values?

Tom Thorn kindly sent me the following link, which is certainly pertinent to this posting: http://imgs.xkcd.com/comics/significant.png

It's always fun to start things off with a snap quiz - it wakes you up, if nothing else. So here we go - multiple choice, so you have at least a 20% chance of getting the correct answer:

Question:    Which of the following statements about p-values is correct?

1. A p-value of 5% implies that the probability of the null hypothesis being true is (no more than) 5%.
2. A p-value of 0.005 implies much more "statistically significant" results than does a p-value of 0.05.
3. The p-value is the likelihood that the findings are due to chance.
4. A p-value of 1% means that there is a 99% chance that the data were sampled from a population that's consistent with the null hypothesis.
5. None of the above.

Monday, April 4, 2011

Curious Regressions

"The picture-examining eye is the best finder we have of the wholly unanticipated"
(John Tukey, 1915 - 2000)

Back in 1992 I participated in a panel discussion at the Australasian Meetings of the Econometric Society, in Melbourne. I don't recall what the topic was for the panel discussion, but I do recall that my brief was to talk about some aspects of "best practice" in teaching econometrics. In case you weren't there, if you slept through my talk, or if you simply hadn't yet learned how to spell "econometrics" back in 1992, I thought I'd share some related pearls of wisdom with you.

One of the main points that I made in that panel discussion could be summarized as: "Plot it or Perish". In other words, if you don't graph your data before undertaking any econometric analysis, then you're running the risk of a major catastrophe. There's nothing new in this message, of course - it's been trumpeted by many eminent statisticians in the past. However, I went further and made a scandalous (but serious) suggestion.

My proposal was that no econometrics computer package should allow you to see any regression results until you'd viewed some suitable data-plots. So, if you were using your favourite package, and issued a generic command along the lines: OLS Y C X, then a scatter-plot of Y against X would appear on your computer screen. You'd be given an option to see other plots (such as log(Y) against log(X), and so on). In the case of a multiple regression model, a command of the form: OLS Y C X1 X2 X3, would result in several partial plots of Y against each of the regressors, etc.. Then, after a prescribed time delay you would eventually see the message:
"Are you abolutely sure that you want to fit this regression model?"

Thursday, March 24, 2011

Dummies for Dummies

The Devil made me do it! It just had to happen sooner or later, and no one else seemed to be willing to bite the bullet. So, I figured it was up to me. I've written the definitive addition to the Dummies series:


O.K., I'm (uncharacteristically) exaggerating just a tad. I think the cover looks good, though; and I've even started to assemble some of the core material, as you'll see below. So what brought on this fit of enthusiasm for what at first blush might be misinterpreted as the neuronically challenged?

Monday, March 21, 2011

From C to Shining C

In each episode of that wonderful long-running public radio show, A Prairie Home Companion, Garrison Keilor always ends his monologue about the good burghers of the mythical town of Lake Wobegon, and the local Norwegian bachelor farmers, with the words:
"That's all of the news from Lake Wobegon - the town where all the women are strong, all the men are good looking, and all the children are above average."
Well, Garrison, do I have news for you! There really is a Lake Wobegon - and we live there! I'm not entirely sure about that bit to do with the men and women, but  apparently the younger folk definitely think that they're all above average - mainly because we've (collectively) told them they are. We have only ourselves to blame.

I'm referring to the horrendous "grade inflation" that's taken in place in our secondary and tertitary education systems, at least in North America. I'm sure we're not alone in the world in this respect, and for all I know the problem may be equally bad in the elementary schools. For whatever reason - and I'm not pointing the finger here (Hmmm) - we've let the students con us into letting them con themselves into believing that every one of them is above average. Worse than that, they firmly believe that a perfectly respectable C, or even a B, grade amounts to what we used to call a FAIL: the dreaded F-word that the PCP (Political Correctness Police) tell us not to use in polite company!

Tuesday, March 15, 2011

Modelling Flowers on the Wall

It probably wasn't what the Statler Brothers actually had in mind as they soared to Number 4 on the U.S. Billboard Hot 100 and Number 1 on the Canadian RPM Top Singles charts in 1965, but around this time of year the good citizens of our town engage in what its organisers descibe as a "light-hearted" week-long activity known as The Victoria Flower Count. In short, this event involves its devotees, and multitudes of coerced school children, in "counting" (we'd call it "estimating") the number of flowers already in bloom in the gardens and parks of the region. Flowering daffodils, snowdrops, heather, and the like are carefully counted as each local municipality in the Greater Victoria region vies to be top dog in their contribution to the grand total count - amounting to 260,457,579 colourful blooms this year.

The 2011 Flower Count  (FC from here on) was held from 1 to 7 March, though historically it's often been held at times ranging from late February to late March. We feel that it's O.K. to bend the rules (sorry - vary the dates) just a little if it helps in making a point - something that you may have noticed already in this blog. Apparently, the idea of the FC is to celebrate the impending demise of our long, dark and bitter three weeks, or so, of winter. Much more importantly, it gives us another chance to annoy the heck out of our friends and relatives who live elsewhere in Canada where they are still checking their calendars and looking forward to half-time in the snow-shovelling game to which they claim to be devoted.

I thought that this FC might provide some interesting data that I could sift through. It probably does, but getting hold of the numbers for past years is not as easy as you might think. I Googled everything under the sun, and eventually came up with what seem to reliable (and disturbingly exact) numbers for 1996 and 2001 to 2011.  At that point I decided to get serious because the clock was ticking, so on Sunday 6 March I emailed the contact person at The Greater Victoria Chamber of Commerce  - the primary organizing body for the FC - as follows:

Wednesday, March 9, 2011

The Second-Longest Word in the Econometrics Dictionary

The other day I paid a surprise visit to my University's library - it was an honest-to-goodness physical visit that involved putting one foot in front of the other, and straining those remaining neurons that deal with my long-term memory - not one of the virtual on-line visits that now pass for the real thing. Back in the day, when all the world and most of you were young and beautiful, an occasional visit to the library was actually quite therapeutic - a nice break from all of those interruptions in the office. It was great to be back, even though I had to focus hard to avoid tripping over old rabbit burrows while en route, and I was somewhat confused by the fact that my favourite large red book had apparently been moved from the very end of the 3rd shelf in the 4th row from the left on Level 2, sometime since September of 2002.

So, what drove me out into the bitter wasteland of Gordon Head in the dead of March? Well, I wanted to take a look at a dictionary that (shame on me) I thought I didn't own. Did you know that there really is A Dictionary of  Econometrics (Darnell, 1994)? It's a very nice volume, and - for the record - the longest word in this dictionary is "heteroskedasticity", with 18 letters. Yes, this word should indeed be spelled with a "k", and not another "c" (see McCulloch, 1985). The second-longest word in that dictionary, with 17 letters is - you guessed it - "multicollinearity". Quite a mouthful, I know, but if you've read this far then I assume that I don't need to bore you by explaining what this blockbuster of a word means.

Monday, March 7, 2011

Less is More (Sometimes)

 “Less is More” - Ludwig Mies van der Rohe

Some of the most influential academic journals have very short (one-word) titles. To wit, Science, Nature, Physica, Biometrika, Geology, Circulation, Polyhedron, Endoscopy, Neuron, and Econometrica. Is there anything in particular that we should conclude from this observation? Well, recently, Schreuder and Oosterveld (2008) took a close look at the relationship between the rankings of 6,033 journals in a wide range of scientific disciplines, and the length of those journals’ titles. For their sample as a whole, and for journals in only five of the individual disciplinary groupings that they considered, they found that there is a significant negative correlation between the journals’ so-called “impact factors” and the number of characters in their title. The opposite result was obtained for the “Pediatrics” and “Urology and Nephrology” fields. It’s actually quite important to analyze data from different disciplines separately from one another, because we’re looking at figs and bananas here. By way of an example, in 2006 the average (highest) impact factor for economics journals was 0.8 (4.7), compared with 4.8 (47.4) in molecular and cell biology (Althouse et al., 2009).

So, what do we find when we look at economics journals in this way?