Friday, June 3, 2011

Eliminating Inflation Through Creative Econometrics

The other evening my wife asked me if tulips are poisonous to cats. I didn't know the answer off hand. The question was prompted by the fact that our furry beast was attempting to graze in the remaining tulips on our patio. (Technically, it was attempting to browse, but that's O.K..) The same tulips I've been staring at for about 7 weeks now!

Here on the We(s)t Coast Spring has been longer, cooler, and more damp this year than any of us would care for. After a while it gets you down, and you feel as if the fog has actually penetrated your brain. Strange thoughts begin to surface, just when you least expect them.

The question about the cat and the tulips interrupted my own contemplation of a notice that I'd seen on campus earlier in the day. It concerned a summer course being offered by our Department of Linguistics here at UVic. namely LING 388: "An Introduction to Grammar of English Usage". I had been thinking that this was something I should recommend to some of our students - until I observed that it said at the bottom of the notice: "No Prerequisites Required." Isn't that third word redundant?

I warned you - this weather does bad things to your mind!

Zanran

Zanran is to data, what Google is to text.

Now in its Beta-testing phase, the new search engine, Zanran, seems certain to appeal to all of us who use data on a regular basis. Founders Jon Goldhill and Yves Dassas describe Zanran in the following way:
"Zanran helps you to find ‘semi-structured’ data on the web. This is the numerical data that people have presented as graphs and tables and charts. For example, the data could be a graph in a PDF report, or a table in an Excel spreadsheet, or a barchart shown as an image in an HTML page. This huge amount of information can be difficult to find using conventional search engines, which are focused primarily on finding text rather than graphs, tables and bar charts."


On 31 May I used Zanran to search "zero inflated Poisson" (see above), and returned 4,394 results, each linking to data in graphs and/or tables. Here are the first 5 items in the list:


When you "hover over" the pdf icons for each of the first three items above, here are the previews that you see:


Then, of course, if you like what you see, you just click your way to the linked document, be it a pdf file, an Excel worksheet, an HTML page, or whatever.

No, I'm not an investor, but this is one cool search engine. Try it - you'll love it!

(HT to Andrew Gelman.)


© 2011, David E. Giles

Thursday, June 2, 2011

World Bank e-Atlas

The World Bank has recently released an "e-Atlas" that provides an interesting collection of maps and graphs for a wide range of economic development indicators. Over 170 indicators are provided for more than 200 countries.

Let's suppose that you want to graphically compare per capita GDP in PPP international dollars for Luxembourg, Norway, and the entire world, from 1980 to 2009. No problem! The data can be compared "on the fly" or exported for further analysis.

What about a comparison of the percentage of births attended by skilled health staff, in Haiti, Kenya, Somalia and Pakistan? It's just a click away. Did you know that this percentage declined from 50% in 1989 to 41.6% in 2003, in Kenya? It was still only 26.1% in Haiti in 2006.

You can also create "zoomable" maps that display the global "distribution" of the variables you're interested in. These maps have nice "hover over" features and can be animated to depict changes over time.

Here are a couple of examples to whet your appetite.

1. Maternal Mortality Rate (The Whole Wide World):


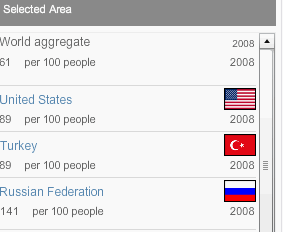
2. Mobile 'Phone Usage (Zoomed in to Selected Region):


This is a nice utility that's definitely worth checking out. And you even get to choose the colours!


© 2011, David E. Giles

Wednesday, June 1, 2011

Well, Knock me Down and Call me Susan!

For your edification I offer (without comment):
Brigitte H. Bechtold, "The Practice of Econometrics: A Feminist Critique", Review of Radical Political Economics, 1999, 31, 40-52.
Check it out, and enjoy (?) !

(HT to The Unbroken Window, 2008.)


© 2011, David E. Giles

Tuesday, May 31, 2011

It's a Wonderful Life

Personally, I'd have gone for a big cake with candles, but last week, to celebrate its 50th anniversary, the OECD released a new "Better Life Index" (BLI) for each of its 34 member-countries. More correctly, 11 different measures were released for each country. These covered the areas of Housing, Income, Jobs, Community, Education, Environment, Governance, Health, Life Satisfaction, Safety and Work-Life Balance.  I've downloaded the data into an Excel workbook that's available on the Data page that goes with this blog.

These measures were aggregated into a single, equally-weighted BLI, which you can see here. In addition to this the OECD has provided a nice interactive tool that allows users to select their own weights across the 11 measures, and then compare the rankings of the countries they're interested in on the basis of this personalized measure. Of course, you could just do this in a spreadsheet, but I guess it's more fun to do it in real-time on their site.

So, as the OECD web site says, you can "decide for yourself what contributes most to well-being." If I wanted to, I could tinker with the weights to see what it would take for me to feel that I'd have a better life by leaving Canada (ranked essentially first equal with Australia using the equal-weight index), and going back to New Zealand (ranked fourth). I'll return to this point below.

Monday, May 30, 2011

Cointegrated at the Hips

Spring is sprung and wedding season is fast approaching. Indeed, some couples have already taken the plunge this Spring. On 28 April, the day before Will and Kate got hitched (sorry - before the Royal nuptials of  Prince William and Catherine Middleton), The Economist magazine's Daily Chart showed the average age at first marriage for males and for females in the United Kingdom, from 1890 to 2010. The piece that accompanied with the chart went under the jolly title of "The Royal We", and discussed trends in marriage ages with markers at various key royal wedding dates over the years.

Several features of the chart were pretty much as you'd anticipate:
  • The average age for grooms exceeds that for brides.
  • There were structural breaks around the end  of the First and Second World Wars.
  • Since about 1970, the average marriage age has been trending upwards (from about 22 and 24 years of age for brides and grooms in 1970; to about 29 and 31 years of age, respectively, in 2010).
Always on the look-out for some new examples for my classes - especially ones that are a little bit "different" in their content - I thought it would be interesting to explore some similar data for U.S. pairings. The following chart shows the median age at first marriage for happy couples entering marriage for the first time between 1947 and 2010. The data are from the U.S. Census Bureau, and are available in the Excel workbook on the Data page that goes with this blog.

Friday, May 20, 2011

Peace Through Statistics

The latest issue of Amstat News (the monthly newsletter of the American Statistical Association) includes this piece. It's about the amazing international effort, spearheaded by Miodrag Lovrić (Serbia), Jasmin Komić (Bosnia and Herzegovina), and Ksenija Dumičić (Croatia),  that has led to the publication of the International Encyclopedia of Statistical Science.

The outreaching efforts of these three statisticians has earned them a nomination for the 2011 Nobel Prize for Peace. The outcome of this year's award will be announced on 7 October, 2011.

The Encyclopedia cotains contributions from 619 authors, repesenting 104 countries around the world. There are lots of names there that will be very familiar to econometricians. These include, among others:

T. W. Anderson, K. J. Arrow, B. Baltagi, G. E. P. Box, S. Chib, J. S. Chipman, D. R. Cox, D. A. Dickey, H. K. van Dijk, B. Efron, C. W. J. Granger, J. D. Hamilton, J. L. Heckman, S. Hylleberg, R. J. Hyndman, C. M. Jarque, P. E. Kennedy, J. Kmenta, W. Krämer, R. S. Mariano, C. R. Rao and A. Spanos.


© 2011, David E. Giles


Tuesday, May 17, 2011

The Monkey Run

May I show you my collection of slide rules?


When it comes to doing econometrics, students today just have no idea how lucky they are - compared with old geezers like me, that is. So, just for the record, this is how it went down when I was running regressions as a student, in the pre-P.C. (personal computer and politically correct) era:


Punch-card with a single SHAZAM command:
GENR  LAHERCPI = LOG(AHERCPI)


Punch-card with one row  (5 integer fields) of input data

Here, we have one row (one sample observation) from a data matrix for five input variables. For a sample of size n there would have been a stack of n cards like this.

Friday, May 13, 2011

Gripe of the Day

I have a pet peeve that I really must get off my chest. Yes, another one! Rest assured, there are plenty more where this comes from.

Logit and Probit models are the joint work-horses of a lot of microeconometric studies. They've been widely used for a very long time, and these days they are frequently used with what I'd call pretty large data-sets - ones where the sample size is in the thousands, or even hundreds of thousands. 

These models are invariably estimated by Maximum Likelihood (ML), and as we all know, ML estimators have great large-sample (asymptotic) properties. Specifically, they're weakly consistent, asymptotically efficient, and asymptotically normal - under specific conditions. These conditions are what we usually term the 'regularity conditions', and these are simply some mild conditions on the derivatives of the underlying density function for the random data in the model. The normal and logistic distributions satisfy these conditions, which were first introduced in the context of the formal properties of ML estimators by Dugué (1937) and Cramér (1946). So, what could go wrong?

Monday, May 9, 2011

A Trick of the Trade

Simultaneous Equations Models (SEMs), together with the treatment of measurement error, lie at the historical foundation of Econometrics as a discipline.

The idea of SEM’s for the economy came from Jan Tinbergen, who estimated a 24-equation system for the Dutch economy in 1936. See Tinbergen (1959, pp.37-84) for an English translation. When the first Nobel Prize in Economic Science was awarded in 1969, Tinbergen shared the inaugural honour with Ragnar Frisch (a Norwegian econometrician) for their pioneering work that led to the development of econometrics as a recognized sub-discipline.

It's not that long ago that courses in econometrics included a solid amount of material relating to SEMs. Consequently, students became well aware of issues surrounding parametric identification. They were also very familiar with a raft of estimators designed to deliver consistent, and perhaps asymptotically efficient,  estimates in the context of simultaneous systems. These included single equation estimators - generally Instrumental Variables (IV) estimators such as 2SLS and the k-class family, including the Limited Information Maximum Likelihood (LIML) estimator; and full system estimators such as 3SLS and Full Information Maximum Likelihood (FIML).

These days, the estimation of SEMs seems to get relatively little attention in standard econometrics courses. Most students learn about 2SLS, and many of them appreciate that this is just a specific member of the IV family of estimators. However, few students realize that all of the other estimators - yes, including FIML - are also in the IV family. For example, see Hendry (1976).