Friday, December 15, 2017

Reading for the Holidays

Here are some suggestions for your Holiday reading:
  • Athey, S. and G. Imbens, 2016. The state of econometrics - Causality and policy evaluation. Mimeo., Graduate School of Business, Stanford University.
  • Cook, J. D., 2010. Testing a random number generator. Chapter 10, in T. Rily and A. Goucher (eds.), Beautiful Testing, O' Reilly Media, Sebastol, CA. 
  • Ivanov, V. and L. Kilian, 2005. A practitioner's guide to lag order selection for VAR impulse response analysis. Studies in Nonlinear Dynamics and Econometrics, 9, article 2.
  • Polanin, J. A., E. A. Hennessy, and E. E. Tanner-Smith, 2016. A review of meta-analysis packages in R. Journal of Educational and Behavioural Statistics, 42, 206-242.
  • Young, A., 2017. Consistency without inference: Instrumental variables in practical application. Mimeo.,  London School of Economics.
  • Zhang, L., 2017, Partial unit root and surplus-lag Granger causality testing: A Monte Carlo simulation study. Communications in Statistics - Theory and Methods, 46, 12317-12323.

© 2017, David E. Giles

Sunday, November 5, 2017

Econometrics Reading List for November

Some suggestions........

  • Garcia, J. and D. E. Ramirez, 2017. The successive raising estimator and its relation with the ridge estimator. Communications in Statistics - Theory and Methods, 46, 11123-11142.
  • Silva, I. R., 2017. On the correspondence between frequentist and Bayesian tests. Communications in Statistics - Theory and Methods, online.
  • Steel, M. F. J., 2017. Model averaging and its use in economics. MPRA Paper No. 81568.
  • Teräsvirta, T., 2017. Nonlinear models in macroeconometrics. CREATES Research Paper 2017-32.
  • Witmer, J., 2017. Bayes and MCMC for undergraduates. American Statistician, 71, 259-274.
  • Zimmerman, C., 2015. On the need for a replication journal. Federal Reserve Bank of St. Louis, Working Paper 2015-016A.
© 2017, David E. Giles

Sunday, October 22, 2017

Another Shout-Out for The Replication Network

Replication in empirical economics is vitally important, and I'm delighted to be a member of The Replication Network. I've mentioned this group in previous blog posts - for instance, here and here.

The list of members of TRN continues to grow - why not consider becoming a member your self? Here's the link that you need to do so. 

The TRN website includes some excellent guest blog posts, the latest of which is about a new journal dedicated to the replication of economic research. The post is by  Martina Grunow, the Managing Editor of the International Journal for Re-Views in Empirical Economics (IREE).

If you haven't checked out TRN, why not do so - and why not join?

© 2017, David E. Giles

Wednesday, October 4, 2017

Recommended Reading for October

  • Andor, N. & C. Parmeter, 2017. Pseudolikelihood estimation of the stochastic frontier model. Ruhr Economic Papers #693.
  • Chalak, K., 2017. Instrumental variables methods with heterogeneity and mismeasured instruments. Econometric Theory, 33, 69-104.
  • Kim, J. H. & I. Choi, 2017. Unit roots in economic and financial time series: A re-evaluation at the decision-based significance levels. Econometrics, 56 (3), 41.
  • Owen, A. B., 2017. Statistically efficient thinning of a Markov chain sampler. Journal of Computational and Graphical Statistics, 26, 738-744. 
  • Owen, P. D., 2017. Evaluating ingenious instruments for fundamental determinants of long-run economic growth and development. Econometrics, 5 (3), 38.
  • Richard, P., 2017. Robust heteroskedasticity-robust tests. Economics Letters, 159, 28-32.

© 2017, David E. Giles

Thursday, September 28, 2017

How Good is That Random Number Generator?

Recently, I saw a reference to an interesting piece from 2013 by Peter Grogono, a computer scientist now retired from Concordia University. It's to do with checking the "quality" of a (pseudo-) random number generator.

Specifically, Peter discusses what he calls "The Pickover Test". This refers to the following suggestion that he attributes to Clifford Pickover (1995, Chap. 31):
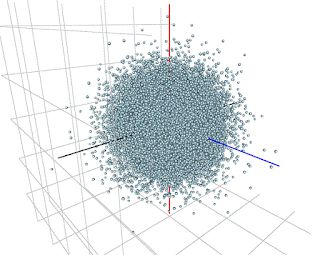
"Pickover describes a simple but quite effective technique for testing RNGs visually. The idea is to generate random numbers in groups of three, and to use each group to plot a point in spherical coordinates. If the RNG is good, the points will form a solid sphere. If not, patterns will appear. 
When it is used with good RNGs, the results of the Pickover Test are rather boring: it just draws spheres. The test is much more effective when it is used with a bad RNG, because it produces pretty pictures." 
Peter provides some nice examples of such pretty pictures!

I thought that it would be interesting to apply the Pickover Test to random numbers produced by the (default) RNG's for various distributions in R.

Before looking at the results, note that is the support of the distribution in question is finite (e.g., the Beta distribution), then the "solid sphere" that is referred to in the Pickover Test will become a "solid box". Similarly, if the support of the distribution is the real half-line (e.g., the Chi-Square distribution), the "solid sphere" will become a "solid quarter-sphere".

You can find the R code that I used on the code page that goes with this blog. Specifically, I used the "rgl" package for the 3-D plots.

Here are some of my results, in each based on a sequence of 33,000 "triplets" of random numbers:

(i) Standard Normal (using "rnorm")


(ii) Uniform on [0 , 1] (using "runif")


(iii) Binomial [n = 100, p = 0.5] (using "rbinom")

(iv) Poisson [mean = 10] (using "rpois")


(v) Standard Logistic (using "rlogis")


(vi) Beta [1 , 2] (using "rbeta")


(vii) Chi-Square [df = 5] (using "rchisq")


(vii) Student-t [df = 3] (using "rt")


(viii) Student-t [df = 7] (using "rt")


(Note that if you run my R code you can rotate the resulting 3-D plots to change the viewing aspect by holding the left mouse key and moving the mouse. You can zoom in and out by "scrolling".)

On the whole, the results look pretty encouraging, as you'd hope! One possible exception is the case of the Student-t distribution with relatively small degrees of freedom.

Of course, the Pickover "Test" is nothing more than a quick visual aid that can alert you to possible problems with your RNG. It's not intended to be a substitute for more formal, and more specific, hypothesis tests for the distribution membership, independence, etc., of your random numbers..


References

Adler, D., D. Murdoch, et al., 2017' 'rgl' package, version 0-98.1.

Pickover, C., 1995. Keys to Infinity. Wiley, New York.


© 2017, David E. Giles
Friday, September 22, 2017

Misclassification in Binary Choice Models

Several years ago I wrote a number of posts about Logit and Probit models, and the Linear Probability Model LPM). One of those posts (also, see here) dealt with the problems that arise if you mis-classify the dependent variable in such models.  That is, in the binary case, if some of your "zeroes" should be "ones", and/or vice versa.

In a conventional linear regression model, measurement errors in the dependent variable are not a biog deal. However, the situation is quite different with Logit, Probit, and the LPM.

This issue is taken up in detail in an excellent, recent, paper by Meyer and Mittag (2017), and I commend their paper to you.

To give you an indication of what those authors have to say, this is from their Introduction:
".....the literature has established that misclassification is pervasive and affects estimates, but not how it affects them or what can still be done with contaminated data. This paper characterizes the consequences of misclassification of the dependent variable in binary choice models and assesses whether substantive conclusions can still be drawn from the observed data and if so, which methods to do so work well. We first present a closed form solution for the bias in the linear probability model that allows for simple corrections. For non-linear binary choice models such as the Probit model, we decompose the asymptotic bias into four components. We derive closed form expressions for three bias components and an equation that determines the fourth component. The formulas imply that if misclassification is conditionally random, only the probabilities of misclassification are required to obtain the exact bias in the linear probability model and an approximation in the Probit model. If misclassification is related to the covariates, additional information on this relation is required to assess the (asymptotic) bias, but the results still imply a tendency for the bias to be in the opposite direction of the sign of the coefficient."
This paper includes a wealth of information, including some practical guidelines for practitioners.

Reference

Meyer, B. D. and N. Mittag, 2017. Misclassification in binary choice models. Journal of Econometrics, 200, 295-311.

© 2017, David E. Giles

Wednesday, September 20, 2017

Monte Carlo Simulations & the "SimDesign" Package in R

Past posts on this blog have included several relating to Monte Carlo simulation - e.g., see here, here, and here.

Recently I came across a great article by Matthew Sigal and Philip Chalmers in the Journal of Statistics Education. It's titled, "Play it Again: Teaching Statistics With Monte Carlo Simulation", and the full reference appears below.

The authors provide a really nice introduction to basic Monte Carlo simulation, using R. In particular, they contrast using a "for loop" approach, with using the "SimDesign" R package (Chalmers, 2017). 

Here's the abstract of their paper:
"Monte Carlo simulations (MCSs) provide important information about statistical phenomena that would be impossible to assess otherwise. This article introduces MCS methods and their applications to research and statistical pedagogy using a novel software package for the R Project for Statistical Computing constructed to lessen the often steep learning curve when organizing simulation code. A primary goal of this article is to demonstrate how well-suited MCS designs are to classroom demonstrations, and how they provide a hands-on method for students to become acquainted with complex statistical concepts. In this article, essential programming aspects for writing MCS code in R are overviewed, multiple applied examples with relevant code are provided, and the benefits of using a generate–analyze–summarize coding structure over the typical “for-loop” strategy are discussed."
The SimDesign package provides an efficient, and safe template for setting pretty much any Monte Carlo experiment that you're likely to want to conduct. It's really impressive, and I'm looking forward to experimenting with it.

The Sigal-Chalmers paper includes helpful examples, with the associated R code and output. It would be superfluous for me to add that here.

Needless to say, the SimDesign package is just as useful for simulations in econometrics as it is for those dealing with straight statistics problems. Try it out for yourself!

References

Chalmers, R. P., 2017. SimDesign: Structure for Organizing Monte Carlo Simulation Designs, R package version 1.7.

M. J. Sigal and R. P. Chalmers, 2016. Play it again: Teaching statistics with Monte Carlo simulation. Journal of Statistics Education, 24, 136-156.

© 2017, David E. Giles

Sunday, September 10, 2017

Econometrics Reading List for September

A little belatedly, here is my September reading list:
  • Benjamin, D. J. et al., 2017. Redefine statistical significance. Pre-print.
  • Jiang, B., G. Athanasopoulos, R. J. Hyndman, A. Panagiotelis, and F. Vahid, 2017. Macroeconomic forecasting for Australia using a large number of predictors. Working Paper 2/17, Department of Econometrics and Business Statistics, Monash University.
  • Knaeble, D. and S. Dutter, 2017. Reversals of least-square estimates and model-invariant estimations for directions of unique effects. The American Statistician, 71, 97-105.
  • Moiseev, N. A., 2017. Forecasting time series of economic processes by model averaging across data frames of various lengths. Journal of Statistical Computation and Simulation, 87, 3111-3131.
  • Stewart, K. G., 2017. Normalized CES supply systems: Replication of Klump, McAdam and Willman (2007). Journal of Applied Econometrics, in press.
  • Tsai, A. C., M. Liou, M. Simak, and P. E. Cheng, 2017. On hyperbolic transformations to normality. Computational Statistics and Data Analysis, 115, 250-266,


© 2017, David E. Giles

Monday, July 31, 2017

My August Reading List

Here are some suggestions for you:
  • Calzolari, G., 2017. Econometrics exams and round numbers: Use or misuse of indirect estimation methods? Communications in Statistics - Simulation and Computation, in press.
  • Chakraborti, S., F. Jardim, & E. Epprecht, 2017. Higher order moments using the survival function: The alternative expectation formula. American Statistician, in press.
  • Clarke, J. A., 2017. Model averaging OLS and 2SLS: An application of the WALS procedure. Econometrics Working Paper EWP1701, Department of Economics, University of Victoria.
  • Hotelling, H., 1940. The teaching of statistics, Annals of Mathematical Statistics, 11, 457-470.
  • Knaeble, B. & S. Dutter, 2017. Reversals of least-square estimates and model-invariant estimation for directions of unique effects. American Statistician, 71, 97-105.
  • Megerdichian, A., 2017. Further results on interpreting coefficients in regressions with a logarithmic dependent variable. Journal of Econometric Methods, in press.

© 2017, David E. Giles

Wednesday, July 12, 2017

The Bandwidth for the KPSS Test

Recently, I received an email from a follower of this blog, who asked:
"May I know what is the difference between the bandwidth of Newey-West and Andrews for the KPSS test. It is because when I test the variable with Newey-West, it is I(2), but then I switch the bandwidth to Andrews, it becomes I(1)."
First of all, it's worth noting that the unit root and stationarity tests that we commonly use can be very sensitive to the way in which they're constructed and applied. An obvious example arises with the choice of the maximum lag length when we're using the Augmented Dickey-Fuller test. Another example would be the treatment of the drift and trend components when using that test, So, the situation that's mentioned in the email above is not unusual, in general terms.

Now, let's look at the specific question that's been raised here.

Saturday, July 1, 2017

Canada Day Reading List

I was tempted to offer you a list of 150 items, but I thought better of it!
  • Hamilton, J. D., 2017. Why you should never use the Hodrick-Prescott filter. Mimeo., Department of Economics, UC San Diego.
  • Jin, H. and S. Zhang, 2017. Spurious regression between long memory series due to mis-specified structural breaks. Communications in Statistics - Simulation and Computation, in press.
  • Kiviet, J. F., 2016. Testing the impossible: Identifying exclusion restrictions.Discussion Paper 2016/03, Amsterdam School of Economics, University of Economics.
  • Lenz, G. and A. Sahn, 2017. Achieving statistical significance with covariates. BITSS Preprint (H/T  Arthur Charpentier)
  • Sephton, P., 2017. Finite sample critical values of the generalized KPSS test. Computational Economics, 50, 161-172.
© 2017, David E. Giles

Monday, June 26, 2017

Recent Developments in Cointegration

Recently, I posted about a special issue of the journal, Econometrics, devoted to "Unit Roots and Structural Breaks".

Another recent special issue of that journal will be of equal interest to readers of this blog. Katerina Juselius has guest- edited an issue titles, "Recent Developments in Cointegration". The papers published so far in this issue are, of course, open-access. Check them out!

© 2017, David E. Giles

Sunday, June 25, 2017

Instrumental Variables & the Frisch-Waugh-Lovell Theorem

The so-called Frisch-Waugh-Lovell (FWL) Theorem is a standard result that we meet in pretty much any introductory grad. course in econometrics.

The theorem is so-named because (i) in the very fist volume of Econometrica Frisch and Waugh (1933) established it in the particular context of "de-trending" time-series data; and (ii) Lovell (1963) demonstrated that the same result establishes the equivalence of "seasonally adjusting" time-series data (in a particular way), and including seasonal dummy variables in an OLS regression model. (Also, see Lovell, 2008.)

We'll take a look at the statement of the FWL Theorem in a moment. First, though, it's important to note that it's purely an algebraic/geometric result. Although it arises in the context of regression analysis, it has no statistical content, per se.

What's not generally recognized, however, is that the FWL Theorem doesn't rely on the geometry of OLS. In fact, it relies on the geometry of the Instrumental Variables (IV) estimator - of which OLS is a special case, of course. (OLS is just IV in the just-identified case, with the regressors being used as their own instruments.)

Implicitly, this was shown in an old paper of mine (Giles, 1984) where I extended Lovell's analysis to the context of IV estimation. However, in that paper I didn't spell out the generality of the FWL-IV result.

Let's take a look at all of this.

Friday, June 23, 2017

Unit Roots & Structural Breaks

The open-access journal, Econometrics (of which I'm happy to be an Editorial Board member), has recently published a special issue on the topic of "Unit Roots and Structural Breaks". 

This issue is guest-edited by Pierre Perron, and it includes eight really terrific papers. You can find the special issue here.

© 2017, David E. Giles

Wednesday, June 7, 2017

Marc Bellemare on "How to Publish in Academic Journals"

If you don't follow Marc Bellemare's blog, you should do.

And if you read only one other blog post this week, it should be this one from Marc, titled, "How to Publish in Academic Journals". Read his slides that are linked in the post.

Great advice that is totally applicable to anyone doing research in econometrics - theory or applied.

© 2017, David E. Giles

Saturday, June 3, 2017

June Reading List

Here are some suggestions for you:
  • Ai, C. and E. C. Norton, 2003. Interaction terms in logit and probit models. Economics Letters, 80, 123-129.
  • Hirschberg, J. and J. Lye, 2017. Inverting the indirect - the ellipse and the Boomerang: Visualizing the confidence intervals of the structural coefficient from two-stage least squares. Journal of Econometrics, in press.
  • Kim, I. and S. Park, 2017. Likelihood ratio tests for multivariate normality. Communications in Statistics - Theory and Methods, in press.
  • Knotek, E. S. and S. Zaman, 2017. Financial nowcasts and their usefulness in macroeconomic forecasting. Working Paper 17-02, Federal Reserve Bank of Cleveland.
  • Marczak, M. and V. Goméz, 2017. Monthly US business cycle indicators: A new multivariate approach based on a band-pass filter. Empirical Economics, 52, 1379-1408.
  • Sherwood, C. and D. W. Kwak, 2017. New insights into an old problem - enhancing student learning outcomes in an introductory statistics course. Applied Economics, in press.
© 2017, David E. Giles

Tuesday, May 23, 2017

Staying on Top of the Literature

Recently, 'Michael' placed the following comment on one of my posts:
"Thanks for sharing this interesting list of articles! I'm wondering, how do you go about finding these types of articles to read? Are you a subscriber to these publications/do you regularly check for new updates online? I'd like to start keeping more up to date with academic articles, but I'm not sure where to start." 
Well, that's a good question, Michael. And I'm sure that there are many undergraduate students and non-academics who wonder the same thing when it comes to keeping up with the latest developments in econometrics. (I've phrased it that way because I'm also sure that grad. students will be getting appropriate advice on this, and other matters from their supervisors.)

Let's take a step back in time first.


Friday, May 19, 2017

The EViews Blog on ARDL - Part 3

As I mentioned in this recent post, the EViews team had a third blog post on ARDL modelling up their sleeves. The said post appeared a few days ago, here.

It's a real gem! The flow-chart and the detailed application are fabulous - I wish I could have come up with this myself.

Read it, read it................

© 2017, David E. Giles

When Everything Old is New Again

Some ideas are so good that they keep re-appearing again and again. In other words, they stand the test of time, and prove to be useful in lots of different contexts – sometimes in situations that we couldn’t have imagined when the idea first came to light.

This certainly happens in econometrics, and here are just a few examples that come to mind.

Tuesday, May 9, 2017

Bounds Testing & ARDL Models - More From the EViews Team

The team at EViews has just released another post about ARDL modelling on their blog. This one is titled, "AutoRegressive Distributed Lag (ARDL) Estimation. Part 2 - Inference". This post is a follow-up to one that they wrote last month, and which I commented on here.

Given by the number of comments and requests that I get about this topic, these two posts from EViews are "must read" items for a lot of you.

And the great news is that there's a third post on the way, and this one will focus on implementing ARDL Modelling/Bounds Testing in EViews,

Great job!
© 2017, David E. Giles

Friday, May 5, 2017

Here's What I've Been Reading

Here are some of the papers that I've been reading recently. Some of them may appeal to you, too:
© 2017, David E. Giles

Tuesday, April 18, 2017

In Praise of T.A.s

With another teaching term completed, I'm reminded of how much we faculty members rely on our Teaching Assistants (T.A.s) This is especially true in the case of large undergraduate classes, where we'd be run off our feet without the invaluable input from these hard-working, often under-appreciated members of the teaching team.

Over the years, I've been especially fortunate to have worked with some very dedicated and conscientious T.A.s. Sometimes, being allocated to one of my courses wasn't their first choice. After all, introductory economic statistics isn't for everyone! None the less, they pitched in, worked hard, and the students in the courses were the beneficiaries. And so was I.

So, thank you all! And if you're a faculty member who relied on your T.A.s as much as I have, don't forget to let them know how important their work is, and how much it's appreciated.

© 2017, David E. Giles

Saturday, April 15, 2017

Jan Kiviet's Book on Monte Carlo Simulation

Monte Carlo simulation is an essential tool that econometricians use a great deal. For an introduction to some aspects of Monte Carlo simulation, see my earlier posts herehere, and here. There are some follow-up posts on this coming up soon.

In the meantime, I was delighted to learn recently about an outstanding book on this topic by Jan Kiviet. The book is titled, Monte Carlo Simulation for Econometricians, and I strongly recommend it.

Of course, Jan's work will be familiar to many readers of this blog, and this book more than lives up to our expectations, given the author's excellent reputation.

Jan uses EViews to illustrate the various issues that are discussed in his book, making the material very accessible to students and researchers alike. 

This is a really nice contribution!
© 2017, David E. Giles

Friday, April 7, 2017

And the Winner is........

The Econometric Game for 2017 has concluded. For the second successive year, the winning team comes from Harvard University.

The "cases" that were used in the 2017 EG can be found here.

Congratulations to the winners, and to all of the other participating teams!

© 2017, David E. Giles

Monday, April 3, 2017

ARDL Models - From the Team at EViews

Today the team at EViews published an important post on their blog. It's titled, "Autoregressive Distributed Lag (ARDL) Estimation. Part 1 - Theory".

If you have an interest in ARDL modelling - and I know that there are lots of you out there - then this is a must read post.

And as you can tell from its title, there's also a follow-up post on the way. So, you should watch out for it.

If  you plan on doing any ARDL modelling, you really can't go past EViews, so take a look.

© 2017, David E. Giles

Sunday, April 2, 2017

Read Some Econometrics this Month!

There are no April Fool's tricks in the following list of suggestions. 😐
© 2017, David E. Giles

Sunday, March 26, 2017

In Praise of Two Giants of Econometrics

Two giants in our field, now deceased, are celebrated in recent Working Papers by Peter Phillips and Timo Teräsvirta.

Peter's paper is titled, "Tribute to T. W. Anderson", is in an issue of Econometric Theory that also includes ted's last published research paper.

Timo's paper, which will be appearing in The Journal of Pure and Applied Mathematics, "Sir Clive Granger's contributions to nonlinear time series and econometrics".

Both papers are essential reading, whether you have a particular interest in the history of econometrics; of if you are a younger researcher who wants to understand the building blocks of our discipline.

© 2017, David E. Giles

Saturday, March 25, 2017

A "Journal of Insignificant (Economic) Results"?

The Replication Network carried a guest blog post by Andrea Menclova this week. The post was titled, "Is it Time for a Journal of Insignificant Results?"

I was previously unaware of the existence of such journals in Psychology, Biomedicine, and Ecology and Evolutionary Biology.

Andrea calls for the introduction of such a journal in Economics, and she makes a really good point.

Take a look at what she has to say!

© 2017, David E. Giles

Sunday, March 19, 2017

The Econometric Game, 2017

This year's edition of The Econometric Game is scheduled to take place next month in Amsterdam.

Specifically, between 5 and 7 April the University of Amsterdam will once again host visiting teams of econometrics students from around the world to compete to become "World Champions of Econometrics". It's a great initiative that's now in its 19th. year.

This year, the competing teams come from:

Aarhus University
Corvinus University of Budapest
ENSAE
Erasmus University Rotterdam
Harvard University
KU Leuven
London School of Economics
Lund University
Maastricht University
McGill University
New Economic School
Oxford University
Stellenbosch University
Tilburg University
Toulouse School of Economics
Universidad Carlos III de Madrid
Universidad del Rosario
University College London
University of Amsterdam
University of Antwerp
University of Copenhagen
University of Economics, Prague
University of Illinois at Urbana-Champaign
University of Lausanne
University of Rome Tor Vergata
University of São Paulo
University of Toronto
University of Warwick
Vrije Universiteit Amsterdam
Warsaw School of Economics

The team from Harvard took first place in 2016. Let's see if they do it again this year!

© 2017, David E. Giles

Wednesday, March 8, 2017

March Reading List

Here are some suggestions for your reading this month:

  • Coble, D. & P. Picheira, 2017. Nowcasting building permits with Google trends. MPRA Paper No. 76514.
  • Mullahy, J., 2017. Marginal effects in multivariate probit models. Empirical Economics, 52, 447-461.
  • Pagan, A., 2017. Some consequences of using "measurement error shocks" when estimating time series models. CAMA Working Paper 12.2017, Cantre for Macroeconomic Analysis, Australian National University.
  • Reed, W. R. & A. Smith, 2017. A time series paradox: Unit root tests perform poorly when data are cointegrated. Economics Letters, 151, 71-74.
  • Zhang, L., 2017. Partial unit root and surplus-lag Granger causality testing: A Monte Carlo simulation study. Communications in Statistics - Theory and Methods, online.
© 2017, David E. Giles

Saturday, February 4, 2017

Econometrics - Young Researcher Award


The journal, Econometrics, hasn't been around all that long, but it has published some great articles by some very prominent econometricians. And it's "open access" to readers, which is always good news.

Today, I received an email with the following important information:

"The journal Econometrics (http://www.mdpi.com/journal/econometrics) is inviting applications and nominations for the 2017 Young Researcher Award. The aim of the award is to encourage and motivate young
researchers in the field of econometrics.
Applications and nominations will be assessed by an evaluation committee chaired by the Editors and composed of Editorial Board Members.
Eligibility Criteria:
a) The upper age limit for the applicant is 40.
b) No more than 10 years since conferral of a PhD degree (by 30 June 2017).
The award will consist of: (1) a certificate; (2) an honorarium of 500 CHF; (3) a voucher for publishing two papers free of charge and without fixed deadlines in Econometrics if the Article Processing Charge will be applied; and (4) a £150 book voucher for PM book series sponsored by Palgrave Macmillan.
The application and nomination pack should include:
1. A Curriculum Vitae, including a complete list of publications and conference activities.
2. A description of the applicant’s major research contributions over the last 5 years, including clear discussions of 3 most representative publications published over the last 5 years. (For each publication, please provide significance of the publication and the applicant’s own contribution to the publication).
3. A letter of nomination from an established econometrician. The letter should highlight the candidate’s achievements and contribution to the field of econometrics.
Please send your application/nomination to the Econometrics Editorial Office at econometrics@mdpi.com by 30 June 2017. The winner will be announced on the Econometrics website in September 2017."

© 2017, David E. Giles

Friday, February 3, 2017

February Reading

Here are some suggestions for your reading list this month:
  • Aastveit, A., C. Foroni, and F. Ravazzolo, 2016. Density forecasts with midas models. Journal of Applied Econometrics, online.
  • Chang, C-L. and M. McAleer, 2016.  The fiction of full BEKK. Tinbergen Institute Discussion Paper TI 2017-015/III.
  • Chudik, A., G. Kapetanios, and M.H. Pesaran, 2016.  A one-covariate at a time, multiple testing approach to variable selection in high-dimensional linear regression models. Cambridge Working Paper Economics: 1667.
  • Kleiber, C.. Structural change in (economic) time series WWZ Working Paper 2016/06, University of Basel.
  • Romano, J. P. and M. Wolf, 2017. Resurrecting weighted least squares. Journal of Econometrics, 197, 1-19.
  • Yamada, H., 2017. Several least squares problems related to the Hodrick-Prescott filtering. Communications in Statistics - Theory and Methods, online.

© 2016, David E. Giles

Saturday, January 28, 2017

Hypothesis Testing Using (Non-) Overlapping Confidence Intervals

Here's something (else!) that annoys the heck out of me. I've seen it come up time and again in economics seminars over the years.

It usually goes something like this:

There are two estimates of some parameter, based on two different models.

Question from Audience: "I know that the two point estimates are numerically pretty similar, but is the difference statistically significant?"

Speaker's Response: "Well, if you look at the two standard errors and mentally compute separate 95% confidence intervals, these intervals overlap, so there's no significant difference, at least at the 5% level."

My Reaction: "What utter crap!  (Eye roll!)

So, what's going on here?

Friday, January 27, 2017

In Honour of Peter Schmidt

The latest issue of Econometric Reviews (Vol 36, Nos. 1-3) is devoted to papers that have been assembled to honour Peter Schmidt, of Michigan State University. Peter's contributions to econometrics have been outstanding, and it's great to see his work celebrated in this way.

In the abstract to their introduction to this collection Essie Maasoumi and Robin Sickles comment as follows:
"Peter Schmidt has been one of its best-known and most respected econometricians in the profession for four decades. He has brought his talents to many scholarly outlets and societies, and has played a foundational and constructive role in the development of the field of econometrics. Peter Schmidt has also served and led the development of Econometric Reviews since its inception in 1982. His judgment has always been fair, informed, clear, decisive, and constructive. Respect for ideas and scholarship of others, young and old, is second nature to him. This is the best of traits, and Peter serves as an uncommon example to us all. The seventeen articles that make up this Econometric Reviews Special Issue in Honor of Peter Schmidt represent the work of fifty of the very best econometricians in our profession. They honor Professor Schmidt’s lifelong accomplishments by providing fundamental research work that reflects many of the broad research themes that have distinguished his long and productive career. These include time series econometrics, panel data econometrics, and stochastic frontier production analysis."
I hope that you get a chance to read the papers in this issue of Econometric Reviews.

© 2017, David E. Giles

Wednesday, January 18, 2017

Quantitative Macroeconomic Modeling with Structural Vector Autoregressions

A terrific new book titled, Quantitative Macroeconomic Modeling with Structural Vector Autoregressions – An EViews Implementation, is now available for free downloading from the EViews site. The book is written by Sam Ouliaris, Adrian Pagan, and Jorge Restrepo.

The "blurb" about this important new book reads:
"Quantitative macroeconomic research is conducted in a number of ways. An important method has been the use of the technique known as Structural Vector Autoregressions (SVARs), which aims to gather information about dynamic processes in macroeconomic systems. This book sets out the theory underlying the SVAR methodology in a relatively simple way and discusses many of the problems that can arise when using the technique. It also proposes solutions that are relatively easy to implement using EViews 9.5. Its orientation is towards applied work and it does this by working with the data sets from some classic SVAR studies."
In my view, EViews is certainly the natural choice for this venture. As the authors note in their Preface:
"A choice had to be made about the computer package that would be used to perform the quantitative work and EViews was eventually selected because of its popularity amongst IMF staff and central bankers more generally."
Gareth Thomas (of EViews) has pointed out to me that: "much of the book is covered in the IMF's free online macroeconomic forecasting course.  The next iteration of which starts in February:
https://www.edx.org/course/macroeconometric-forecasting-imfx-mfx-0 "

I'm sure that this new resource will be very well received!

© 2017, David E. Giles

Tuesday, January 17, 2017

Royal Economic Society Webcasts on Econometrics

The Royal Economic Society has recently released videos of interviews with three leading econometricans, recorded during the Society's 2016 Meeting. These are: 

Webcasts of Special (Econometrics) Sessions at RES Meetings between 2011 and 2016 are also available for viewing - here.     
© 2017, David E. Giles

Friday, January 13, 2017

Vintage Years in Econometrics - The 1970's

Continuing on from my earlier posts about vintage years for econometrics in the 1930's, 1940's, 1950's, 1960's, here's my tasting guide for the 1970's.

Once again, let me note that "in econometrics, what constitutes quality and importance is partly a matter of taste - just like wine! So, not all of you will agree with the choices I've made in the following compilation."

Monday, January 9, 2017

Trading Models and Distributed Lags

Yesterday, I received an email from Robert Hillman.

Robert wrote:
"I’ve thoroughly enjoyed your recent posts and associated links on distributed lags. I’d like to throw in a slightly different perspective.
 To give you some brief background on myself: I did a PhD in econometrics 1993-1998 at Southampton University. ............ I now manage capital and am heavily influenced by my study of econometrics and in particular exploring the historical foundations of many things that today that look new and funky but are probably old but no less funky!
I wanted to draw attention to the fact that many finance practitioners have long used ‘models’ that in my view are robust and heuristic versions of nonlinear ADL models. I’m not sure this interpretation is as widely recognised as it could be."
With Robert's permission, you can access the full contents of what Robert had to say, here

Robert provides some interesting and useful insights into the connections between certain trading models and ARDL models, and I thought that these would be useful to readers of this blog.

Thanks, Robert!

© 2017, David E. Giles

Sunday, January 8, 2017

When is a Dummy Variable Not a Dummy Variable?

In econometrics we often use "dummy variables", to allow for changes in estimated coefficients when the data fall into one "regime" or another. An obvious example is when we use such variables to allow the different "seasons" in quarterly time-series data.

I've posted about dummy variables several times in the past - e.g., here

However, there's one important point that seems to come up from time to time in emails that I receive from readers of this blog. I thought that a few comments here might be helpful.


Saturday, January 7, 2017

Jagger's Theorem

Recently I watched (for the n'th time!) The Big Chill. If you're a fan of this movie, and its terrific sound-track, then this post will be even more meaningful to you.😊

And if you're reading this because you thought it might be about Mick Jagger, then you won't be disappointed!

Before we go any further, let me make it totally clear that I stole this post's title - I couldn't have made up anything that enticing no matter how hard I tried!

With that confession, let me state Jagger's Theorem, and then I'll explain what this is all about.

Jagger's Theorem:  "You can't always get what you want."

Friday, January 6, 2017

Explaining the Almon Distributed Lag Model

In an earlier post I discussed Shirley Almon's contribution to the estimation of Distributed Lag (DL) models, with her seminal paper in 1965.

That post drew quite a number of email requests for more information about the Almon estimator, and how it fits into the overall scheme of things. In addition, Almon's approach to modelling distributed lags has been used very effectively more recently in the estimation of the so-called MIDAS model. The MIDAS model (developed by Eric Ghysels and his colleagues - e.g., see Ghysels et al., 2004) is designed to handle regression analysis using data with different observation frequencies. The acronym, "MIDAS", stands for "Mixed-Data Sampling". The MIDAS model can be implemented in R, for instance (e.g., see here), as well as in EViews. (I discussed this in this earlier post.)

For these reasons I thought I'd put together this follow-up post by way of an introduction to the Almon DL model, and some of the advantages and pitfalls associated with using it.

Let's take a look.

Thursday, January 5, 2017

Reproducible Research in Statistics & Econometrics

The American Statistical Association has recently introduced reproducibility requirements for articles published in its flagship journal, The Journal of the American Statistical Association.

The following is extracted from p.17 of the July 2016 issue of Amstat News:


Coming from one of the most prestigious statistics journals, this is good news for everyone!

We could do with more of this in the econometrics journals, and in those economics journals that publish empirical studies. 

To that end, I again commend The Replication Network.


© 2017, David E. Giles