Showing posts with label Dummy variables. Show all posts

Friday, July 6, 2018

Interpreting Dummy Variable Coefficients After Non-Linear Transformations

Dummy variables - ones that take only the values zero and one - are commonly used as regressors in regression models. I've devoted several posts to discussing various aspects of such variables, notably here, but also here, here, and here.

When the regression model in question is linear, in both the variables and the parameters, the interpretation of coefficient of such a dummy variable is simple. Suppose that the model takes the form:

    yi = α + β Di + Σj γj Xji + ε    ;     E(ε) = 0   ;   i = 1, ...., n.                          (1)

The range of summation in the term on the right-hand side of (1) is from 1 to k, if there are k regressors in addition to the dummy variable, D. (There is no loss of generality in assuming a single dummy regressor in what follows, and no further distributional assumptions about the error term will be needed or used.)

As you'll know, if Di = 0, then the intercept coefficient in (1) is just α; and it shifts to (α + β) if Di = 1. It changes by an amount equal to β, and so does the predicted mean value of y. Conversely, this amount changes by -β  if Di changes from 1 to 0. Estimating (1) by OLS will give us an estimate of the effect on y of Di sw from 0 to 1 in value, or vice versa.

But a bit more on estimation issues below!


Another way of interpreting what is going on is to think about the growth rate in the expected value of y that is implied when D changes its value. Setting Di = 0, and then Di = 1, this growth rate is:

   g01i = [ (α + β + Σj γj Xji) - (α Σj γj Xji)] / (α Σj γj Xji) = [β /  (α Σj γj Xji)] ,

which you can multiply by 100 to convert it into a percentage rate of growth, if you wish. 

Note that this growth rate depends on the other parameters in the model, and also on the sample values for the other regressors

Conversely, when D changes in value from 1 to 0, this growth rate is different, namely:

   g10i = - [β / (α + β + Σj γj Xji)]                            (i = 1, ...., n).

In this fully linear model these growth rates offer a somewhat less appealing way of summarizing what is going on than does the amount of change in the expected value of y. The latter doesn't depend on the other parameters of the model, or on the sample values of the regressors.

However, this situation can change very quickly once we move to a regression model that is non-linear, either in the variables or in the parameters (or both). 

That's what I want to focus on in this post. 

Let's consider some interesting examples that involve common transformations of the dependent variable in a regression model. Apart from anything else, such transformations are often undertaken to make the assumption of a normally distributed error term more reasonable.

Sunday, July 1, 2018

Dummy Variables in a Semilogarithmic Regression: Exact Distributional Results

For better or worse, semilogarithmic regression models are used a lot in empirical economics. 

It would be nice to think that this is because the researcher found that a logarithmic transformation of the model's dependent variable led to residuals that were more "normally" distributed than without the transformation. Unfortunately, however, it's often just "for convenience". With this transformation, the estimates of the regression coefficients have a simple interpretation, as explained below

I hate it when the latter situation arises. I've long since lost track of the number of times I've been at a seminar where the speaker has used this "simple interpretation" as an excuse for their choice of a semilogarithmic regression specification. For goodness sake, the choice of the model's functional form should be based on more than "convenience"!

For some of my previous comments about this point, see this post.

Most of you will know that when our semilogarithmic model includes a dummy (zero-one) regressor, we have to be careful about how we interpret that regressor's estimated coefficient. Suppose that we have the following regression model, where D is a dummy variable, and the X's are regresssors that are measured "continuously"

   ln(yi) = α + β Di + Σj γj Xji + ε    ;     E(ε) = 0   ;   i = 1, ...., n.                         

Note that there's no loss of generality here in having just one dummy variable in the model.

Then, the interpretation of the regression coefficients is:
  1. A one-unit change in Xj leads to a proportional change of  γj (or a percentage change of 100γj) in y.
  2. When the dummy variable changes from D = 0 to D = 1, the proportional change in y is [exp(β) -1]. Conversely, going from D = 1 to D = 0 implies a proportional change in y of  [exp(-β) -1]. Again, multiply by 100 to get a percentage change.
See Halvorsen and Palmquist (1980) for an explanation of the second of these results, and my comments in this earlier post.

Kennedy (1981) and Giles (1982) discuss the issue of estimating this proportional change in the case of the dummy variable. Their results relate to point estimation - with a focus on unbiased estimation of the proportional change, when the model's errors are normally distributed..

But what about interval estimation of this effect? 

Sunday, January 8, 2017

When is a Dummy Variable Not a Dummy Variable?

In econometrics we often use "dummy variables", to allow for changes in estimated coefficients when the data fall into one "regime" or another. An obvious example is when we use such variables to allow the different "seasons" in quarterly time-series data.

I've posted about dummy variables several times in the past - e.g., here

However, there's one important point that seems to come up from time to time in emails that I receive from readers of this blog. I thought that a few comments here might be helpful.


Saturday, December 24, 2016

Top New Posts of 2016

Thank you to all readers of this blog for your continued involvement during 2016.

Of the new posts released this year, the Top Five in terms of page-views were:
  1. Forecasting From an Error Correction Model
  2. I Was Just Kidding......!
  3. Choosing Between the Logit and Probit Models
  4. The Forecasting Performance of Models for Cointegrated Data
  5. A Quick Illustration of Pre-Testing Bias
Season's greetings!

© 2016, David E. Giles

Thursday, November 3, 2016

I Was Just Kidding......!

Back in 2011 I wrote a post that I titled, "Dummies for Dummies". It began with the suggestion that I'd written a book of that name, and it included this mock-up of the "cover":


(Thanks to former grad. student, Jacob Schwartz, for helping with the pic.)

Although I did say, "O.K., I'm (uncharacteristically) exaggerating just a tad", apparently a few people took me too seriously/literally. I've had a couple of requests for the book, and even one of my colleagues asked me when it would be appearing.

Sadly, no book was ever intended - somehow, I just don't think there's the market for it!

© 2016, David E. Giles

Friday, September 2, 2016

Dummies with Standardized Data

Recently, I received the following interesting email request:
"I would like to have your assistance regarding a few questions related to regression with standardized variables and a set of dummy variables. First of all, if the variables are standardized (xi-x_bar)/sigma, can I still run the regression with a constant? And, if my dummy variables have 4 categories, do I include all of them without the constant? Or just three and keep the constant in the regression? And, how do we interpret the coefficients of the dummy variables in such as case? I mean, idoes the conventional interpretation in a single OLS regression still apply?"

Here's my (brief) email response:
"If all of the variables (including the dependent variable) have been standardized then in general there is no need to include an intercept - in fact the OLS estimate of its coefficient will be zero (as it should be).
However, if you have (say) 4 categories in the data that you want to allow for with dummy variables, then the usual results apply:
1. You can include all 4 dummies (but no intercept). The estimated coefficients on the dummies will sum to zero with standardized data. Each separate coefficient gives you the deviation from zero for the intercept in each category.
OR (equivalently)
2. You can include an intercept and any 3 of the dummies. Again, the estimated coefficients of the dummies and the intercept will sum to zero. Suppose that you include the intercept and the dummies D2, D3, and D4. The estimated coefficient of the intercept gives you the intercept effect for category 1. The estimated coefficient for D2 gives you the deviation of the intercept for category 2, from that for category 1, etc."
You can easily verify this by fitting a few OLS regressions, and there's a lot more about regression analysis with standardized data in this earlier post of mine.


© 2016, David E. Giles

Wednesday, May 4, 2016

My Latest Paper About Dummy Variables

Over the years I've posted a number of times about various aspects of using dummy variables in regression models. You can use the "Search" window in the right sidebar of this page if want to take a look at those posts.

One of my earlier working papers on this topic has now been accepted for publication.

The paper is titled, "On the Inconsistency of Instrumental Variables Estimators for the Coefficients of Certain Dummy Variables". Here's the abstract:
"In this paper we consider the asymptotic properties of the Instrumental Variables (IV) estimator of the parameters in a linear regression model with some random regressors, and other regressors that are dummy variables. The latter have the special property that the number of non-zero values is fixed, and does not increase with the sample size. We prove that the IV estimator of the coefficient vector for the dummy variables is inconsistent, while that for the other regressors is weakly consistent under standard assumptions. However, the usual estimator for the asymptotic covariance matrix of the I.V. estimator for all of the coefficients retains its usual consistency. The t-test statistics for the dummy variable coefficients are still asymptotically standard normal, despite the inconsistency of the associated IV coefficient estimator. These results extend the earlier results of Hendry and Santos (2005), which relate to a fixed-regressor model, in which the dummy variables are non-zero for just a single observation, and OLS estimation is used".
You can download the final working paper version of the paper from here.

The paper will be appearing in an upcoming issue of Journal of Quantitative Economics.


© 2016, David E. Giles

Saturday, October 26, 2013

Segmented Regression - Some (Relatively) Early References

In response to a recent post of mine on "segmented regression", an anonymous reader asked if I knew when such regressions first appeared in the literature. I'm not sure of the very first reference, but there was certainly an active literature on this by the mid 1960's.

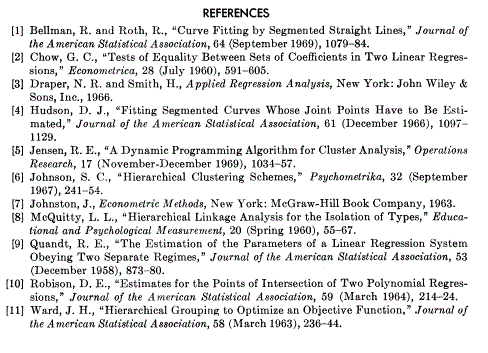
One good reference is V. E. McGee and W. T. Carleton (1970), "Piecewise Regression", Journal of the American Statistical Association, 65, 1109-1124. Those authors cite the following other material, which includes several earlier papers on this topic:

Hopefully, this is helpful.


© 2013, David E. Giles

Tuesday, October 22, 2013

Solution to the Segmented Regression Problem

Here's my solution to the "segmented regression" problem that I posed yesterday. Thanks for the comments and suggestions!

You'll recall that what we wanted to do was to end up with a fitted least squares "line" looking like this:

In particular, the "kink" in the line is at a pre-determined point - in this example when x = 30.

Here's how we can achieve this:

Friday, September 27, 2013

More Interesting Papers to Read

Here's my latest list of suggested reading:

  • Bayer, C. and C. Hanck, 2012. Combining non-cointegration tests. Journal of Time Series AnalysisDOI: 10.1111/j.1467-9892.2012.814.x 
  • Cipollina, M., L. De Benedictis, L. Salvatici, and C. Vicarelli, 2013.  A note on dummies for policies in gravity models: A Monte Carlo experiment. Working Paper no. 180, Dipartimento di Economia, Università degli studi Roma Tre.
  • Fair, R. C., 2013. Reflections on macroeconometric modelling. Cowles Foundation Discussion Paper No. 1908, Yale University.
  • Kourouklis, S., 2012. A new estimator of the variance based on minimizing mean squared error. The American Statistician, 66, 234-236.
  • Kulish, M. and A. R. Pagan, 2013. Issues in estimating new-Keynesian Phillips curves in the presence of unknown structural change. Research Discussion Paper, RDP 2012-11, Reserve Bank of Australia.
  • Little, R. J., 2013. In praise of simplicity, not mathematistry! Ten simple powerful ideas for the statistical scientist. Journal of the American Statistical Association, 108, 359-369.
  • Zhang, L., X. Xu, and G. Chen, 2012. The exact likelihood ratio test for equality of two normal populations. The American Statistician, 66, 180-184.


© 2013, David E. Giles

Friday, July 19, 2013

Some Current Projects

I often get emails asking me what research projects I'm working on. Generally, I have several projects underway at any given time - usually at various stages of development or completion. In that respect I guess I'm pretty typical.

I also tend to have a mixture of theoretical and applied projects, some econometric and some essentially statistical in nature. I find that this provides some continuity in my work. It's not easy to focus on just one or two research projects all of the time, especially if they're not progressing as well as you'd like them to!

So, what am I up to right now? Here are some of the papers/projects that I'm working on:

Friday, April 12, 2013

This Week's Reading

This past week I've been somewhat pre-occupied with the final exams for my undergraduate Economic Statistics course, and graduate Econometrics, courses. However, I've still managed to get some reading done, including the following miscellaneous papers:

Friday, February 8, 2013

I Think It's Them!

The other day I was refereeing a paper, and I thought back to an earlier post from April of last year - "Is it Me or is it Them ??"

'Reminiscing', you say?

Hardly - it's just that I'm still reading far too many empirical (usually micro.) papers in which the econometric "analysis" leaves me shaking my head.

I'm not going to repeat the previous post (you can read it for yourselves), and I certainly can't afford another session with Jane right now.

However, I'm pleased to be able to report that I do think I'm making some progress with my issues!

I've decided that it's not me - it's them!

(That feels better.)


© 2013, David E. Giles

Friday, September 14, 2012

Dummy Variables - Again!

In a previous post (here) I had a few things to say about the dummy variables that we often use in regression analysis. I'm currently making changes to a related paper of mine that's at the "revise and re-submit" stage with a journal. So, to get further feedback, I presented the material in my department's Brown Bag seminar series earlier this week.

If you're interested, you can download the slides for that presentation from here.


© 2012, David E. Giles

Monday, April 18, 2011

Laughing Our Way Out of a Recession

Don't ask me why, but the other day I was thinking about one of my all-time favourite opening sentences in an academic paper:

         "0.    Introduction.   Consider a light bulb."
         (Balkema and de Haan, 1974, p.792.)

It has a certain ring to it, doesn't it? It takes courage to begin a paper in that way. More courage than I have! From there, it was just a small leap to begin reminiscing about memorable light bulb jokes, but I'm not going to go down that track. Actually, I don't have a stock of econometrics jokes, though I recognize that many jokes are very "transportable" across professions. For instance, we could quite easily convert the line, "Once I couldn't even spell 'Engineer' - now I are one!", into something that hits a little closer to home, also beginning with an 'E'. But I digress!

In recent times there's been a lot of press relating to measuring 'happiness' (whatever that is), and to the idea that perhaps we should replace measures such as GDP with some sort of Gross National Happiness Index, at least for certain purposes. I'm not sure what I could possibly add to that discussion directly, but it got me thinking about how our mood is governed in part by the state of the economy, and that perhaps this is reflected in our use of humour to deal with both personal and economic depression.

A lot of cartoons that appear in newspapers and magazines relate, not too surprisingly, to political events and politicians. Political satire has always been popular. It's also the case that a decent number of these cartoons relate specifically to economic matters. Of course, I know that there is often an overlap between economics and politics. None the less, I think we'll all agree that we regularly see cartoons whose primary focus is some aspect of the economy.

Thursday, March 24, 2011

Dummies for Dummies

The Devil made me do it! It just had to happen sooner or later, and no one else seemed to be willing to bite the bullet. So, I figured it was up to me. I've written the definitive addition to the Dummies series:


O.K., I'm (uncharacteristically) exaggerating just a tad. I think the cover looks good, though; and I've even started to assemble some of the core material, as you'll see below. So what brought on this fit of enthusiasm for what at first blush might be misinterpreted as the neuronically challenged?