Thursday, February 8, 2018

ASA Symposium on Statistical Inference - Recorded Sessions

In October of last year, the American Statistical Association held a two-day Symposium on Statistical Inference in Bethesda, MD.

The symposium was sub-titled, Scientific Method for the 21st. Century: A World Beyond p < 0.05. That gives you some idea of what it was about.

The ASA has now released video recordings of several of the sessions at the symposium, and you can find them here.

The video sessions include:

"Why Is Eliminating P-Values So Hard? Reflections on Science and Statistics." (Steve Goodman)

"What Have We (Not) Learnt from Millions of Scientific Papers with P-Values?" (John Ioannidis)

"Understanding the Needs for Statistical Evidence of Decision-Makers in Medicine." (Madhu Mazumdar, Keren Osman, & Elizabeth Garrett-Mayer) 

"Statisticians: Sex Symbols, Liars, Both, or Neither?" (Christie Aschwanden, Laura Helmuth, & Aviva Hope Rutkin) 

"The Radical Prescription for Change." (Andrew Gelman, Marcia McNutt, & Xiao-Li Meng)

Closing Session: “Take the Mic”

The videos are stimulating and timely. I hope that you enjoy them.

© 2018, David E. Giles

Saturday, February 3, 2018

Bayesian Econometrics Slides

Over the years, I included material on Bayesian Econometrics in various courses that I taught - especially at the grad. level. I retired from teaching last year, and I thought that some of you might be interested in the slides that I used when I taught a Bayesian Econometrics topic for the last time.

I hope that you find them useful - just click on the numbers below.

1. General Background
2. Constructing Prior Distributions
3. Properties of Bayes Estimators and Tests
4. Bayesian Inference for the Linear Regression Model
5. Bayesian Computation
6. More Bayesian Computation 
7. Acceptance-Rejection Sampling
8. The Metropolis-Hastings Algorithm
9. Model Selection - Theory
10. Model Selection - Applications
11. Consumption Function Case Study
© 2018, David E. Giles

Tuesday, January 2, 2018

Econometrics Reading for the New Year

Another year, and lots of exciting reading!
  • Davidson, R. & V. Zinde-Walsh, 2017. Advances in specification testing. Canadian Journal of Economics, online.
  • Dias, G. F. & G. Kapetanios, 2018. Estimation and forecasting in vector autoregressive moving average models for rich datasets. Journal of Econometrics, 202, 75-91.  
  • González-Estrada, E. & J. A. Villaseñor, 2017. An R package for testing goodness of fit: goft. Journal of Statistical Computation and Simulation, 88, 726-751.
  • Hajria, R. B., S. Khardani, & H. Raïssi, 2017. Testing the lag length of vector autoregressive models:  A power comparison between portmanteau and Lagrange multiplier tests. Working Paper 2017-03, Escuela de Negocios y EconomÍa. Pontificia Universidad Católica de ValaparaÍso.
  • McNown, R., C. Y. Sam, & S. K. Goh, 2018. Bootstrapping the autoregressive distributed lag test for cointegration. Applied Economics, 50, 1509-1521.
  • Pesaran, M. H. & R. P. Smith, 2017. Posterior means and precisions of the coefficients in linear models with highly collinear regressors. Working Paper BCAM 1707, Birkbeck, University of London.
  • Yavuz, F. V. & M. D. Ward, 2017. Fostering undergraduate data science. American Statistician, online. 

© 2018, David E. Giles

Monday, January 1, 2018

Interpolating Statistical Tables

We've all experienced it. You go to use a statistical table - Standard Normal, Student-t, F, Chi Square - and the line that you need simply isn't there in the table. That's to say the table simply isn't detailed enough for our purposes.

One question that always comes up when students are first being introduced to such tables is:
"Do I just interpolate linearly between the nearest entries on either side of the desired value?"
Not that these exact words are used, typically. For instance, a student might ask if they should take the average of the two closest values. How should you respond?


Friday, December 15, 2017

Reading for the Holidays

Here are some suggestions for your Holiday reading:
  • Athey, S. and G. Imbens, 2016. The state of econometrics - Causality and policy evaluation. Mimeo., Graduate School of Business, Stanford University.
  • Cook, J. D., 2010. Testing a random number generator. Chapter 10, in T. Rily and A. Goucher (eds.), Beautiful Testing, O' Reilly Media, Sebastol, CA. 
  • Ivanov, V. and L. Kilian, 2005. A practitioner's guide to lag order selection for VAR impulse response analysis. Studies in Nonlinear Dynamics and Econometrics, 9, article 2.
  • Polanin, J. A., E. A. Hennessy, and E. E. Tanner-Smith, 2016. A review of meta-analysis packages in R. Journal of Educational and Behavioural Statistics, 42, 206-242.
  • Young, A., 2017. Consistency without inference: Instrumental variables in practical application. Mimeo.,  London School of Economics.
  • Zhang, L., 2017, Partial unit root and surplus-lag Granger causality testing: A Monte Carlo simulation study. Communications in Statistics - Theory and Methods, 46, 12317-12323.

© 2017, David E. Giles

Sunday, November 5, 2017

Econometrics Reading List for November

Some suggestions........

  • Garcia, J. and D. E. Ramirez, 2017. The successive raising estimator and its relation with the ridge estimator. Communications in Statistics - Theory and Methods, 46, 11123-11142.
  • Silva, I. R., 2017. On the correspondence between frequentist and Bayesian tests. Communications in Statistics - Theory and Methods, online.
  • Steel, M. F. J., 2017. Model averaging and its use in economics. MPRA Paper No. 81568.
  • Teräsvirta, T., 2017. Nonlinear models in macroeconometrics. CREATES Research Paper 2017-32.
  • Witmer, J., 2017. Bayes and MCMC for undergraduates. American Statistician, 71, 259-274.
  • Zimmerman, C., 2015. On the need for a replication journal. Federal Reserve Bank of St. Louis, Working Paper 2015-016A.
© 2017, David E. Giles

Sunday, October 22, 2017

Another Shout-Out for The Replication Network

Replication in empirical economics is vitally important, and I'm delighted to be a member of The Replication Network. I've mentioned this group in previous blog posts - for instance, here and here.

The list of members of TRN continues to grow - why not consider becoming a member your self? Here's the link that you need to do so. 

The TRN website includes some excellent guest blog posts, the latest of which is about a new journal dedicated to the replication of economic research. The post is by  Martina Grunow, the Managing Editor of the International Journal for Re-Views in Empirical Economics (IREE).

If you haven't checked out TRN, why not do so - and why not join?

© 2017, David E. Giles

Wednesday, October 4, 2017

Recommended Reading for October

  • Andor, N. & C. Parmeter, 2017. Pseudolikelihood estimation of the stochastic frontier model. Ruhr Economic Papers #693.
  • Chalak, K., 2017. Instrumental variables methods with heterogeneity and mismeasured instruments. Econometric Theory, 33, 69-104.
  • Kim, J. H. & I. Choi, 2017. Unit roots in economic and financial time series: A re-evaluation at the decision-based significance levels. Econometrics, 56 (3), 41.
  • Owen, A. B., 2017. Statistically efficient thinning of a Markov chain sampler. Journal of Computational and Graphical Statistics, 26, 738-744. 
  • Owen, P. D., 2017. Evaluating ingenious instruments for fundamental determinants of long-run economic growth and development. Econometrics, 5 (3), 38.
  • Richard, P., 2017. Robust heteroskedasticity-robust tests. Economics Letters, 159, 28-32.

© 2017, David E. Giles

Thursday, September 28, 2017

How Good is That Random Number Generator?

Recently, I saw a reference to an interesting piece from 2013 by Peter Grogono, a computer scientist now retired from Concordia University. It's to do with checking the "quality" of a (pseudo-) random number generator.

Specifically, Peter discusses what he calls "The Pickover Test". This refers to the following suggestion that he attributes to Clifford Pickover (1995, Chap. 31):
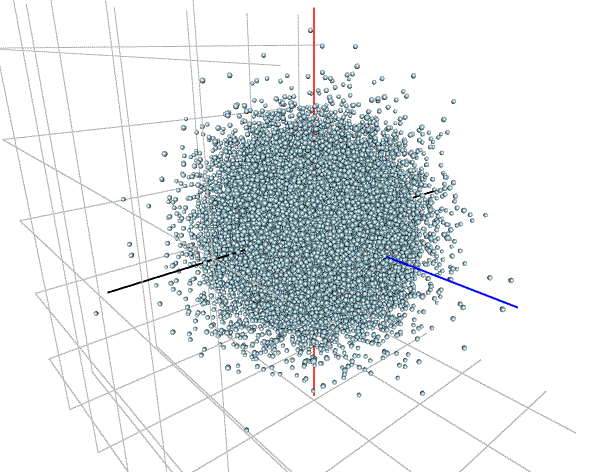
"Pickover describes a simple but quite effective technique for testing RNGs visually. The idea is to generate random numbers in groups of three, and to use each group to plot a point in spherical coordinates. If the RNG is good, the points will form a solid sphere. If not, patterns will appear. 
When it is used with good RNGs, the results of the Pickover Test are rather boring: it just draws spheres. The test is much more effective when it is used with a bad RNG, because it produces pretty pictures." 
Peter provides some nice examples of such pretty pictures!

I thought that it would be interesting to apply the Pickover Test to random numbers produced by the (default) RNG's for various distributions in R.

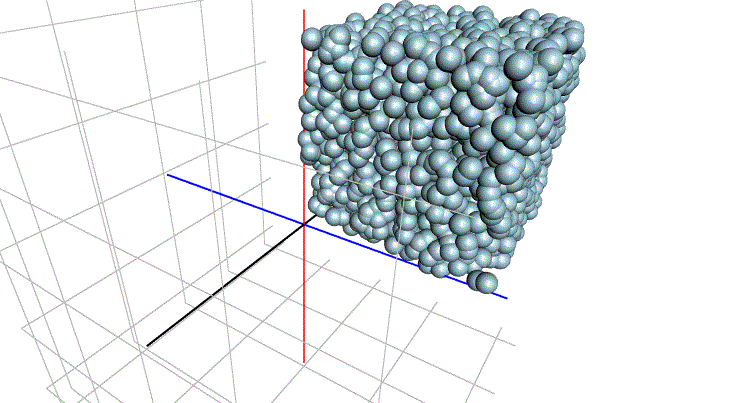
Before looking at the results, note that is the support of the distribution in question is finite (e.g., the Beta distribution), then the "solid sphere" that is referred to in the Pickover Test will become a "solid box". Similarly, if the support of the distribution is the real half-line (e.g., the Chi-Square distribution), the "solid sphere" will become a "solid quarter-sphere".

You can find the R code that I used on the code page that goes with this blog. Specifically, I used the "rgl" package for the 3-D plots.

Here are some of my results, in each based on a sequence of 33,000 "triplets" of random numbers:

(i) Standard Normal (using "rnorm")


(ii) Uniform on [0 , 1] (using "runif")


(iii) Binomial [n = 100, p = 0.5] (using "rbinom")

(iv) Poisson [mean = 10] (using "rpois")


(v) Standard Logistic (using "rlogis")


(vi) Beta [1 , 2] (using "rbeta")


(vii) Chi-Square [df = 5] (using "rchisq")


(vii) Student-t [df = 3] (using "rt")


(viii) Student-t [df = 7] (using "rt")


(Note that if you run my R code you can rotate the resulting 3-D plots to change the viewing aspect by holding the left mouse key and moving the mouse. You can zoom in and out by "scrolling".)

On the whole, the results look pretty encouraging, as you'd hope! One possible exception is the case of the Student-t distribution with relatively small degrees of freedom.

Of course, the Pickover "Test" is nothing more than a quick visual aid that can alert you to possible problems with your RNG. It's not intended to be a substitute for more formal, and more specific, hypothesis tests for the distribution membership, independence, etc., of your random numbers..


References

Adler, D., D. Murdoch, et al., 2017' 'rgl' package, version 0-98.1.

Pickover, C., 1995. Keys to Infinity. Wiley, New York.


© 2017, David E. Giles

Friday, September 22, 2017

Misclassification in Binary Choice Models

Several years ago I wrote a number of posts about Logit and Probit models, and the Linear Probability Model LPM). One of those posts (also, see here) dealt with the problems that arise if you mis-classify the dependent variable in such models.  That is, in the binary case, if some of your "zeroes" should be "ones", and/or vice versa.

In a conventional linear regression model, measurement errors in the dependent variable are not a biog deal. However, the situation is quite different with Logit, Probit, and the LPM.

This issue is taken up in detail in an excellent, recent, paper by Meyer and Mittag (2017), and I commend their paper to you.

To give you an indication of what those authors have to say, this is from their Introduction:
".....the literature has established that misclassification is pervasive and affects estimates, but not how it affects them or what can still be done with contaminated data. This paper characterizes the consequences of misclassification of the dependent variable in binary choice models and assesses whether substantive conclusions can still be drawn from the observed data and if so, which methods to do so work well. We first present a closed form solution for the bias in the linear probability model that allows for simple corrections. For non-linear binary choice models such as the Probit model, we decompose the asymptotic bias into four components. We derive closed form expressions for three bias components and an equation that determines the fourth component. The formulas imply that if misclassification is conditionally random, only the probabilities of misclassification are required to obtain the exact bias in the linear probability model and an approximation in the Probit model. If misclassification is related to the covariates, additional information on this relation is required to assess the (asymptotic) bias, but the results still imply a tendency for the bias to be in the opposite direction of the sign of the coefficient."
This paper includes a wealth of information, including some practical guidelines for practitioners.

Reference

Meyer, B. D. and N. Mittag, 2017. Misclassification in binary choice models. Journal of Econometrics, 200, 295-311.

© 2017, David E. Giles