In a recent post I discussed some aspects of the distributions of some common test statistics when the null hypothesis that's being tested is actually false. One of the things that we saw there was that in many cases these distributions are "non-central", with a non-centrality parameter that increases as we move further and further away from the null hypothesis being true.
In such cases, it's the value of the non-centrality parameter that determines the power of tests. For a particular sample size and choice of significance level, this parameter usually depends on the all of the other features of the testing problem in question.
To illustrate this in more detail, let's consider a linear multiple regression model:
where the k regressors are non-random. Suppose that we want to test the validity of J (< k) independent, linear, restrictions on β. The null and alternative hypotheses can be written as:
H0: Rβ = q vs. H1: Rβ ≠ q
where R is (J x k), non-random, and of rank k; and q is (J x 1) and also non-random. The elements of R and q will be known, as we'll be assigning them when we specify the restrictions that we want to test.
If b is the OLS estimator of β, and e is the OLS residual vector, then the uniformly most powerful invariant test of H0 is based on the statistic,
F = (Rb - q)' [R(X'X)-1R']-1 (Rb - q) / [J (e'e) / (n - k)] .
We can also express this statistic as:
F = [(e*'e* - e'e) / J] / [(e'e) / (n - k)] ,
where e* is the residual vector obtained when we estimate the model using restricted least squares.
The statistic, F, has a non-central F distribution under the above assumptions. The degrees of freedom are J and (n - k); and the non-centrality parameter is
λ = (Rβ - q)' [R(X'X)-1R']-1 (Rβ - q) / (2σ2).
(Warning! The literature is split on what convention should be followed in defining λ. Many authors define it without the "2" in the denominator. This can be very confusing, so be aware of this.)
Clearly, the non-centrality parameter is unobservable, and it takes increasingly positive values as the null hypothesis becomes more and more false. That is, it increases the "gap" between the vectors Rβ and q increases.
In the special case where H0 is true, Rβ = q, and λ = 0. In this case the non-central F distribution collapses to the usual (central) F distribution that we're familiar with. We use this fact to obtain the critical value associated with a chosen significance level; and then we reject H0 if the computed value of F exceeds this critical value,
In the special case where H0 is true, Rβ = q, and λ = 0. In this case the non-central F distribution collapses to the usual (central) F distribution that we're familiar with. We use this fact to obtain the critical value associated with a chosen significance level; and then we reject H0 if the computed value of F exceeds this critical value,
Notice that the value of λ depends not only on the extent to which the null hypothesis is false, but also on all of the unknown parameters in the model; on the form of the restrictions being tested; and also on the X data.
When we talk about the "Power" of this F test, we're looking at the probability that the test will lead to a rejection of H0, when in fact H0 is false. As noted already, a rejection of H0 will arise when (for a chosen significance level, α) the computed value of the F statistic exceeds the critical value, c(α). The power is a conditional probability:
Power = Pr.[Reject H0 | H0 False] = Pr.[F > c(α) | λ ≥ 0].
As λ changes, so does the distribution of F - in a monotonic manner. Here's an example, for a particular choice of degrees of freedom:

In this plot, the critical value associated with a 5% significance level is shown with the green marker. (The R code that I used to create this plot is on the code page for this blog.)
So, by computing the probability that defines the power - for various increasing values of λ - we can plot out the power function for the F test. Such probabilities are the areas to the right of "crit", under the coloured densities in the plot shown above.The corresponding area under the black density is the significance level - namely, 5%.
The next thing I'm going to discuss is how you can compute these probabilities that are needed to evaluate this power curve.
Let's look at a random variable that follows a non-central F distribution. By definition, it's of the form:
F = [χ2(v1,λ) / v1] / [χ2(v2) / v2] ,
where the two χ2 random variables are statistically independent. The numerator χ2 variable is non-central, while the denominator one is central (i.e., its non-centrality parameter is zero). Recall that in our particular example of testing linear restrictions on a regression coefficient vector, v1 = J, and v2 = (n - k).
So,
Power = Pr.[F > c(α) | λ ≥ 0]
= Pr.{[χ2(J,λ) / J] / [χ2(n-k) / (n - k)] > c(α) | λ} .
Notice that we can re-write this ratio of weighted χ2 variables as a difference of such variables:
Power = Pr.{ (1 / J) χ2(J,λ) - (c(α) / (n - k)) χ2(n-k) < 0 | lambda} .
The power changes as different values of λ are inserted into the formula for the density function of the non-central χ2 variable.
The distribution of this "weighted difference" of χ2 variables is not of any standard form. However, all is not lost. Some years ago the New Zealand statistician, Robert Davies, devised a method (Davies 1973, 1980), and wrote the code for computing the cumulative distribution function of a weighted sum of several (possibly non-central) χ2 random variables, with weights that can be either positive or negative.
(Actually, his code allows for a slightly more general problem, but we can ignore that fact here. Also, it should be noted that other authors (beginning with Imhof, 1961) have provided code for the case where all of the χ2 random variables are central.)
Robert's original program (Davies, 1980) was written in ALGOL! Fortunately for us, he later re-wrote the program in FORTRAN and in C++, and the code can be downloaded freely from his website.
I've used Robert's code for this general type of problem a lot over the years. It's very fast and extremely accurate. Moreover, you can control the accuracy of the code for the integration required for the inversion of the characteristic function, if you wish. The above "trick" - converting the ratio of variables into a difference of these variables, can be used in a lot of situations in econometrics.
For this post, I've written a small FORTRAN program, FPower, that incorporates his "qf.for" code. I used the Lahey-Fujitsu 7.6 FORTRAN compiler for 64-bit Windows. The source code and the executable file are available on the code page for this blog. My program prompts you to key in some information, and the results are written to a file titled FPowerOut.txt that will be located in the same folder (directory) as the executable file.
For this post, I've written a small FORTRAN program, FPower, that incorporates his "qf.for" code. I used the Lahey-Fujitsu 7.6 FORTRAN compiler for 64-bit Windows. The source code and the executable file are available on the code page for this blog. My program prompts you to key in some information, and the results are written to a file titled FPowerOut.txt that will be located in the same folder (directory) as the executable file.
Here are some results produced with FPower. As you can see, the significance level of the F-test has been set to 5%, and various values have been chosen for the numerator and denominator degrees of freedom (v1 and v2 respectively). Recall that in the context of testing the validity of exact linear restrictions on a regression coefficient vector, v1 would be the number of restrictions, and v2 would be the regression degrees of freedom before the restrictions are taken into account. That is, v2 = (n - k), where n is the sample size and k is the number of regressors in the model
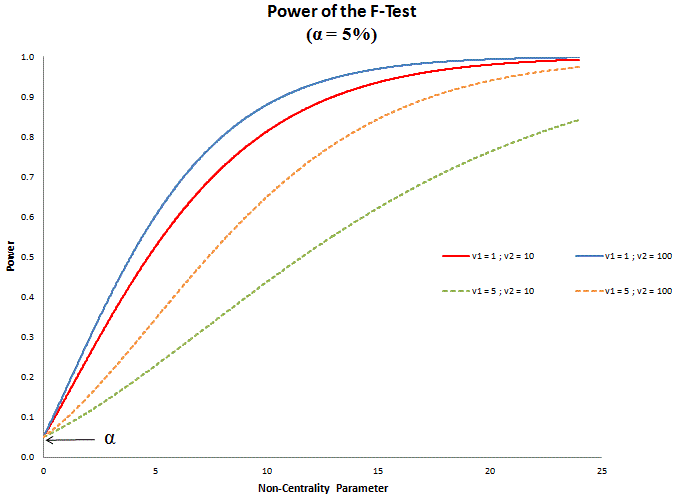
For a fixed number of regressors, increasing v2 from 10 to 100 is equivalent to increasing the sample size. As the F-test is a "consistent" test, this increase in n leads to an increase in the power of the test for all non-zero values of the non-centrality parameter (for a fixed value of v1). Intuitively, the additional information in the sample enables the test to "perform" better when it comes to identifying false null hypotheses, however false they are.
As I noted above, I've used Robert Davies' code quite a lot in my research over the years. Situations where you need to determine the distribution of a ratio of quadratic forms in normal random vectors arise a lot in econometrics.
One simple example is if you want to compute the exact critical value for the Durbin-Watson statistic, for your particular X matrix. In this case, the trick of converting the ratio to a weighted difference can be used; there is no non-centrality parameter to worry about; so Imohf's code can be used in place of Davies' code if you wish. This was first discussed by Koerts and Abrahamse (1971). On the other hand, if you want to compute exact power functions for the DW test, a non-centrality parameter enters the picture once again, so Robert's code can be used.
Other examples of where I (and my co-authors) have used Robert Davies code can be found in Giles and Clarke (1989), Giles and Small (1991), Carrodus and Giles (1992), Giles and Scott (1992), Small et al. (1994), and Giles and Giles (1996).
References
Carrodus, M. L. and D. E. A. Giles, 1992. The exact distribution of R2 when the regression disturbances are autocorrelated. Economics Letters, 38, 375-380.
Davies, R. B., 1973. Numerical inversion of a characteristic function. Biometrika, 60, 415-417.
Davies, R. B., 1980. Algorithm AS155: The distribution of a linear combination of χ2 random variables. Applied Statistics, 29, 323-333.
Giles, D. E. A. and J. A. Clarke, 1989. Preliminary-test estimation of the scale parameter in a mis-specified regression model. Economics Letters, 30, 201-205.
Giles, D. E. A. and M. Scott, 1992. Some consequences of using the Chow test in the context of autocorrelated disturbances. Economics Letters, 38, 145-150.
Giles, D. E. A. and J. P. Small, 1991. The power of the Durbin-Watson test when the errors are heteroskedastic. Economics Letters, 36, 37-41.
Giles, J. A. and D. E. A. Giles, 1996. Risk of a homoscedasticity pre-test estimator of the regression scale under LINEX loss. Journal of Statistical Planning and Inference, 50, 21-35.
Imhof, J. P., 1961. Computing the the distribution of quadratic forms in normal variables. Biometrika, 48, 419-426.
Koerts, J. and A. P. J. Abrahamse, 1971. On the Theory and Application of the General Linear Model. Rotterdam University Press, Rotterdam.
Small, J. P., D. E. A. Giles, and K. J. White, 1994. The exact powers of some autocorrelation tests when relevant regressors are omitted. Journal of Statistical Computation and Simulation, 50, 45-57.
Nice! Is there an R package with the FORTRAN or C++ functions available?
ReplyDeleteNo - unfortunately there's not.
DeleteNice post!
ReplyDelete