Thursday, November 6, 2014

The Village Idiot Hypothesis

Yesterday, I received an email from Michael Belongia (Economics, U. Mississippi). With it, he kindly sent a copy of the Presidential Address to the American Agricultural Economics Association in 1979. The talk, given by Richard A. King, was titled "Choices and Consequences". It makes interesting reading, and many of the points that King makes are just as valid today as they were in 1979.

He has a lot to say about empirical consumer demand studies, especially as they relate to agricultural economics. In particular, he's rightly critical of the very restrictive characteristics of the Linear Expenditure System (Stone, 1954), and the Rotterdam Model (Theil, 1975). However, many of the objections that King raised were overcome just a year later with the "Almost Ideal Demand System" introduced by Deaton and Muellbauer (1980). 

However, it was my recent post on hypothesis testing that prompted Michael to email me, and King makes some telling observations on this topic in his address.

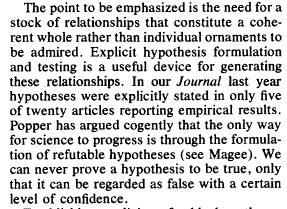
I liked this remark about the need to be explicit about the hypotheses that we have in mind when undertaking empirical work:

King also talks about "The Village Idiot Hypothesis", in relation to the preoccupation with testing hypotheses such as β = 0. 
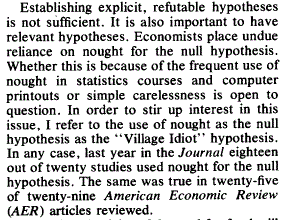


As Michael said to me in his email, "When, as in one example, decades of research have indicated that some elasticity is -0.2, why do new papers test whether β = 0 rather than β = -0.2?"

If you have access to the American Journal of Agricultural Economics, I recommend that you take a look at Richard King's address, as he makes several other important points that practitioners should take to heart.


References


King, R. A., 1979. Choices and consequences. American Journal of Agricultural Economics, 61, 839-848.

Deaton, A. and J. Muellbauer, 1980. An almost ideal demand system. American Economic Review, 70, 312-326.

Stone, R.1954. Linear expenditure systems and demand analysis: An application to the pattern of British demand".Economic Journal, 64, 511-527.

Theil, H., 1975. Theory and Measurement of Consumer Demand, Vol. 1. North-Holland, Amsterdam.


© 2014, David E. Giles

Update to ARDL Add-In for EViews

In a post back in January, I drew attention to an Add-In for EViews that allows you to estimate ARDL models. The Add-In was written by Yashar Tarverdi. At that time, one limitation was that the Add-In handles only two variables, X and Y.

Judging by the questions and feedback I get about ARDL models, I know you'll be delighted to know that this limitation has been eased considerably. News out of @IHSEViews on Twitter this morning announces that the Add-In will now handle up to ten variables.

Good job! And thanks!

© 2014, David E. Giles

Wednesday, November 5, 2014

Computing Power Curves

In a recent post I discussed some aspects of the distributions of some common test statistics when the null hypothesis that's being tested is actually false. One of the things that we saw there was that in many cases these distributions are "non-central", with a non-centrality parameter that increases as we move further and further away from the null hypothesis being true.

In such cases, it's the value of the non-centrality parameter that determines the power of tests. For a particular sample size and choice of significance level, this parameter usually depends on the all of the other features of the testing problem in question.

To illustrate this in more detail, let's consider a linear multiple regression model:

Monday, November 3, 2014

Central and Non-Central Distributions

Let's imagine that you're teaching an econometrics class that features hypothesis testing. It may be an elementary introduction to the topic itself; or it may be a more detailed discussion of a particular testing problem. We're not talking here about a course on Bayesian econometrics, so in all likelihood you'll be following the "classical" Neyman-Pearson paradigm.

You set up the null and alternative hypotheses. You introduce the idea of a test statistic, and hopefully, you explain why we try to find one that's "pivotal". You talk about Type I and Type II errors; and the trade-off between the probabilities of these errors occurring. 

You might talk about the idea of assigning a significance level for the test in advance of implementing it; or you might talk about p-values. In either case, you have to emphasize to the classt that in order to apply the test itself, you have to know the sampling distribution of your test statistic for the situation where the null hypothesis is true.

Why is this?

Sunday, November 2, 2014

Confusing Charts

Today's on-line edition of The New Zealand Herald includes an article titled "Junior rugby putting little kids in harm's way". The article included two charts, presented one after the other, and explicitly intended to be viewed as a a pair. Here they are:


Why on earth didn't they use the same colour-coding for the four age groups in both charts?


© 2014, David E. Giles

Friday, October 31, 2014

Recent Reading

From my "Recently Read" list:
  • Born, B. and J. Breitung, 2014. Testing for serial correlation in fixed-effects panel data models. Econometric Reviews, in press.
  • Enders, W. and Lee. J., 2011. A unit root test using a Fourier series to approximate smooth breaks, Oxford Bulletin of Economics and Statistics, 74, 574-599.
  • Götz, T. B. and A. W. Hecq, 2014. Testing for Granger causality in large mixed-frequency VARs. RM/14/028, Maastricht University, SBE, Department of Quantitative Economics.
  • Kass, R. E., 2011. Statistical inference: The big picture. Statistical Science, 26, 1-9.
  • Qian, J. and L. Su, 2014. Structural change estimation in time series regressions with endogenous variables. Economics Letters, in press.
  • Wickens, M., 2014. How did we get to where we are now? Reflections on 50 years of macroeconomic and financial econometrics. Discussion Paper No. 14/17, Department of Economics and Related Studies, University of York.
© 2014, David E. Giles

Thursday, October 30, 2014

Testing......1, 2, 3, ......

I often think that most courses in econometric theory are somewhat unbalanced. Much more attention is given to estimation principles and estimator properties than is given to the principles of hypothesis testing, the properties of tests.

This always strikes me as somewhat ironic. In econometrics we're at least as interested in testing some interesting economic hypotheses as we are in estimating some particular parameters.

For that reason, even my introductory undergraduate "economic statistics" course always includes some basic material on the properties of tests. By this I mean properties such Uniformly Most Powerful; Locally Most Powerful; Consistent; and Unbiased. (With respect to the last two properties I do  mean test properties, not estimator properties.)

After all, when you're first learning about hypothesis testing, it's important to know that there are sound justifications for using the particular tests that are being taught. We don't use the "t-test" simply because it was first proposed by a brewer! Or, for that matter, because tables of critical values are in an appendix of our text book. We use it because, under certain circumstances, it is Uniformly Most Powerful (against one-sided alternative hypotheses).

If tests aren't motivated and justified in this sort of way, we're just dishing out recipes to our students. And I've never liked the cookbook approach to the teaching of statistics or econometrics.

There's a lot to blog about when it comes to hypothesis testing. In some upcoming posts I'll try and cover some testing topics which, in my view, are given too little attention in traditional econometrics courses.

To whet your appetite - the first two will be about the distributions of some standard test statistics when the null hypothesis is false; and how this information can be used to compute some power curves.


© 2014, David E. Giles

Wednesday, October 29, 2014

Econometrics Term Test

A few days ago the students in my introductory graduate Econometrics course had their mid-term test.

Here's the test, and a brief solution.

How did you fare?


© 2014, David E. Giles

Tuesday, October 28, 2014

Would You Like Some Hot Potatoes?

O.K., I know - that was a really cheap way of getting your attention.

However, it worked, and this post really is about Hot Potatoes - not the edible variety, but some teaching apps. from "Half-Baked Software" here at the University of Victoria.

To quote: 
"The Hot Potatoes suite includes six applications, enabling you to create interactive multiple-choice, short-answer, jumbled-sentence, crossword, matching/ordering and gap-fill exercises for the World Wide Web. Hot Potatoes is freeware, and you may use it for any purpose or project you like."
I've included some Hot Potatoes multiple choice exercises on the web pages for several of my courses for some years now. Recently, some of the students in my introductory graduate econometrics course mentioned that these exercises were quite helpful. So, I thought I'd share the Hot Potatoes apps. for that course with readers of this blog.

There are eight multiple-choice exercise sets in total, and you can run  them from here:

I've also put the HTML and associated PDF files on the code page for this blog. If you're going to download them and use them on your own computer or website, just make sure that the PDF files are located in the same folder (directory) as the HTML files.
I plan to extend and update these Hot Potatoes exercises in the near future, but hopefully some readers will find them useful in the meantime.
© 2014, David E. Giles

Friday, October 17, 2014

Econometric Research Resources

The following page, put together by John Kane at the Department of Economics, SUNY-Oswego, has some very useful links for econometrics students and researchers: Econometric Research Resources


© 2014, David E. Giles