Friday, November 14, 2014

Cointegration - The Definitive Overview

Recently released, this discussion paper from Søren Johansen, will give you the definitive overview of cointegration that you've been waiting for.

Titiled simply, "Time Series: Cointegration", Johansen's paper has been prepared for inclusion in the 2nd. edition of The International Encyclopedia of the Social and Behavioural Sciences, 2014. In the space of just sixteen pages, you'll find pretty much everything you need or want to know about cointegration.

To get you started, here's the abstract:
"An overview of results for the cointegrated VAR model for nonstationary I(1) variables is given. The emphasis is on the analysis of the model and the tools for asymptotic inference. These include: formulation of criteria on the parameters, for the process to be nonstationary and I(1), formulation of hypotheses of interest on the rank, the cointegrating relations and the adjustment coefficients. A discussion of the asymptotic distribution results that are used for inference. The results are illustrated by a few examples. A number of extensions of the theory are pointed out."
Enjoy!


© 2014, David E. Giles

Tuesday, November 11, 2014

Normality Testing & Non-Stationary Data

Bob Jensen emailed me about my recent post about the way in which the Jarque-Bera test can be impacted when temporally aggregated data are used. Apparently he publicized my post on the listserv for Accounting Educators in the U.S.. He also drew my attention to a paper from Two former presidents of the AAA: "Some Methodological Deficiencies in Empirical Research Articles in Accounting", by Thomas R. Dyckman and Stephen A. Zeff, Accounting Horizons, September 2014, 28 (3), 695-712. (Here.) 

Bob commented that an even more important issue might be that our data may be non-stationary. Indeed, this is always something that should concern us, and regular readers of this blog will know that non-stationary data, cointegration, and the like have been the subject of a lot of my posts.

In fact, the impact of unit roots on the Jarque-Bera test was mentioned in this old post about "spurious regressions". There, I mentioned a paper of mine (Giles, 2007) in which I proved that:

Read Before You Cite!

Note to self - file this post in the "Look Before You Leap" category!

Looking at The New Zealand Herald newspaper this morning, this headline caught my eye:

"How Did Sir Owen Glenn's Domestic Violence Inquiry Get $7 Billion Figure Wrong?"

$7 Billion? Even though that's (only) New Zealand dollars, it still sounds like a reasonable question to ask, I thought. And (seriously) this is a really important issue, so, I read on.

Here's part of what I found (I've added the red highlighting):

Monday, November 10, 2014

Reverse Regression Follow-up

At the end of my recent post on Reverse Regression, I posed three simple questions - homework for the students among you, if you will. 

Here they are again, with brief "solutions":

Sunday, November 9, 2014

A Source of Irritation

I very much liked one of ECONJEFF's posts last week, titled "Epistemological Irritation of the Day".

The bulk of it reads:
" "A direct test of the hypothesis is looking for significance in the relationship between [one variable] and {another variable]."
No, no, no, no, no. Theory makes predictions about signs of coefficients, not about significance levels, which also depend on minor details such as the sample size and the amount of variation in the independent variable of interest present in the data."
He was right to be upset - and see his post for the punchline!


© 2014, David E. Giles

Saturday, November 8, 2014

Econometric Society World Congress

Every five years, the Econometric Society holds a World Congress. In those years, the usual annual European, North American, Latin American, and Australasian meetings are held over.

The first World Congress was held in Rome, in 1960. I've been to a few of these gatherings over the years, and they're always great events.

The next World Congress is going to be held in Montréal, Canada, in August of 2015. You can find all of the details right here.

Something to look forward to!

© 2014, David E. Giles

A Reverse Regression Inequality

Suppose that we fit the following simple regression model, using OLS:

            yi = βxi + εi   .                                                              (1)

To simplify matters, suppose that all of the data are calculated as deviations from their respective sample means. That's why I haven't explicitly included an intercept in (1). This doesn't affect any of the following results.

The OLS estimator of β is, of course,

            b = Σ(xiyi) / Σ(xi2) ,

where the summations are for i = 1 to n (the sample size).

Now consider the "reverse regression":

           xi = αyi + ui   .                                                             (2)

The OLS estimator of α is

           a = Σ(xiyi) / Σ(yi2).

Clearly, a ≠ (1 / b), in general. However, can you tell if a ≥ (1 / b), or if a ≤ (1 / b)?

The answer is, "yes", and here's how you do it.

Friday, November 7, 2014

The Econometrics of Temporal Aggregation V - Testing for Normality

This post is one of a sequence of posts, the earlier members of which can be found here, here, here, and here. These posts are based on Giles (2014).

Some of the standard tests that we perform in econometrics can be affected by the level of aggregation of the data. Here, I'm concerned only with time-series data, and with temporal aggregation. I'm going to show you some preliminary results from work that I have in progress with Ryan Godwin. Although these results relate to just one test, our work covers a range of testing problems.

I'm not supplying the EViews program code that was used to obtain the results below - at least, not for now. That's because what I'm reporting is based on work in progress. Sorry!

As in the earlier posts, let's suppose that the aggregation is over "m" high-frequency periods. A lower case symbol will represent a high-frequency observation on a variable of interest; and an upper-case symbol will denote the aggregated series.

So,
               Yt = yt + yt - 1 + ......+ yt - m + 1 .

If we're aggregating monthly (flow) data to quarterly data, then m = 3. In the case of aggregation from quarterly to annual data, m = 4, etc.

Now, let's investigate how such aggregation affects the performance of the well-known Jarque-Bera (1987) (J-B) test for the normality of the errors in a regression model. I've discussed some of the limitations of this test in an earlier post, and you might find it helpful to look at that post (and this one) at this point. However, the J-B test is very widely used by econometricians, and it warrants some further consideration.

Consider the following small Monte Carlo experiment.

Thursday, November 6, 2014

The Village Idiot Hypothesis

Yesterday, I received an email from Michael Belongia (Economics, U. Mississippi). With it, he kindly sent a copy of the Presidential Address to the American Agricultural Economics Association in 1979. The talk, given by Richard A. King, was titled "Choices and Consequences". It makes interesting reading, and many of the points that King makes are just as valid today as they were in 1979.

He has a lot to say about empirical consumer demand studies, especially as they relate to agricultural economics. In particular, he's rightly critical of the very restrictive characteristics of the Linear Expenditure System (Stone, 1954), and the Rotterdam Model (Theil, 1975). However, many of the objections that King raised were overcome just a year later with the "Almost Ideal Demand System" introduced by Deaton and Muellbauer (1980). 

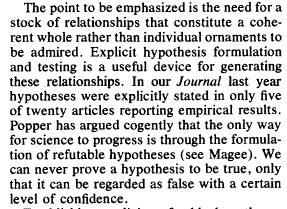
However, it was my recent post on hypothesis testing that prompted Michael to email me, and King makes some telling observations on this topic in his address.

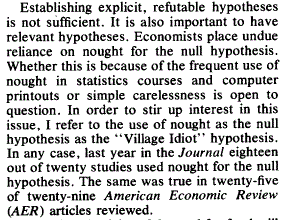
I liked this remark about the need to be explicit about the hypotheses that we have in mind when undertaking empirical work:


King also talks about "The Village Idiot Hypothesis", in relation to the preoccupation with testing hypotheses such as β = 0. 


As Michael said to me in his email, "When, as in one example, decades of research have indicated that some elasticity is -0.2, why do new papers test whether β = 0 rather than β = -0.2?"

If you have access to the American Journal of Agricultural Economics, I recommend that you take a look at Richard King's address, as he makes several other important points that practitioners should take to heart.


References


King, R. A., 1979. Choices and consequences. American Journal of Agricultural Economics, 61, 839-848.

Deaton, A. and J. Muellbauer, 1980. An almost ideal demand system. American Economic Review, 70, 312-326.

Stone, R., 1954. Linear expenditure systems and demand analysis: An application to the pattern of British demand".Economic Journal, 64, 511-527.

Theil, H., 1975. Theory and Measurement of Consumer Demand, Vol. 1. North-Holland, Amsterdam.


© 2014, David E. Giles

Update to ARDL Add-In for EViews

In a post back in January, I drew attention to an Add-In for EViews that allows you to estimate ARDL models. The Add-In was written by Yashar Tarverdi. At that time, one limitation was that the Add-In handles only two variables, X and Y.

Judging by the questions and feedback I get about ARDL models, I know you'll be delighted to know that this limitation has been eased considerably. News out of @IHSEViews on Twitter this morning announces that the Add-In will now handle up to ten variables.

Good job! And thanks!

© 2014, David E. Giles